Go beyond vanity stats. Learn the essential metrics for content marketing, from awareness to revenue, and how to track them for real business impact.
Simply counting pageviews is a classic mistake. It won't tell you if your content is actually working. The most important metrics for content marketing are the ones that connect your efforts to real business goals, like generating leads and driving revenue—not just chasing vanity numbers.
Success isn't about tracking everything. It's about measuring what truly matters.
Moving Beyond Pageviews to Metrics That Matter
Let's be honest—relying on pageviews alone is like trying to navigate a ship by only looking at the waves. It tells you something is happening, but it offers zero clue if you're headed in the right direction. To truly understand your content's impact, you need a more focused approach that maps specific metrics to concrete business objectives.
Think of your content analytics like a pilot's dashboard. You need different instruments for different parts of the flight:
- Reach metrics show your speed and how far you're traveling.
- Engagement metrics measure your altitude and how smoothly you're flying.
- Revenue metrics confirm you're approaching your final destination.
This is a critical shift in mindset. We often chase metrics that are easy to count but don't actually count for much. To get a real sense of your content's value, it's crucial to measure content performance beyond page views.
To help you connect these concepts to your customer journey, here's a quick reference table.
Key Content Metrics by Marketing Funnel Stage
This table summarizes which metrics are most important at each stage of the marketing funnel, from initial awareness to the final purchase.
Using a framework like this helps ensure you're not just creating content, but creating content that moves people from one stage to the next.
The Foundation of Predictable Growth
A predictable, growth-oriented content program is built on a foundation of accurate data. When you can trust your numbers, you move from guessing to knowing. This is what allows you to double down on what works, cut what doesn't, and forecast future results with confidence.
The core challenge isn't the absence of data, but the overwhelming presence of noisy, often misleading, metrics. The goal is to isolate the signals that directly correlate with business growth, turning your content program from a cost center into a predictable revenue driver.
This diagram shows how you can organize your metrics into a clear hierarchy, flowing from broad reach all the way down to direct revenue impact.
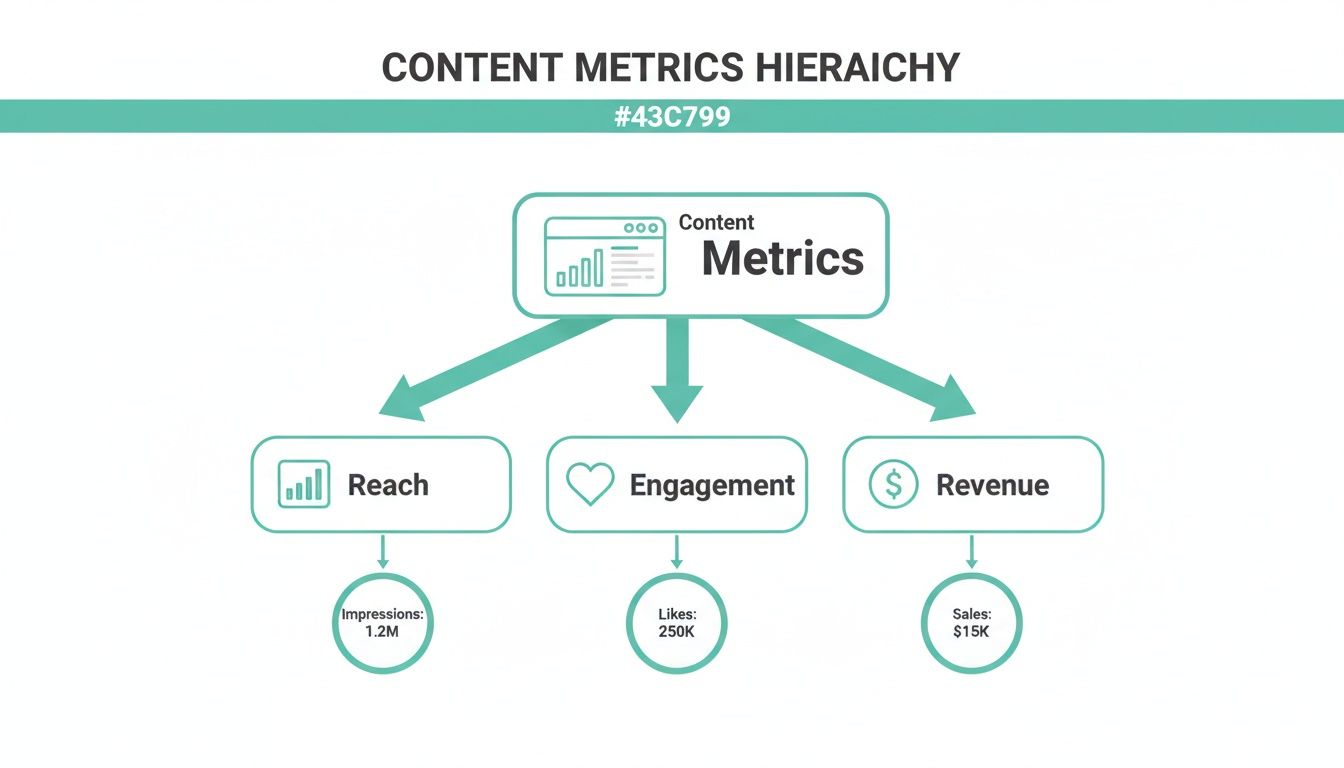
This structure is incredibly helpful because it shows how top-of-funnel activities ultimately contribute to bottom-line results. Without this clarity, marketing teams can easily get stuck optimizing for metrics that don't actually move the needle on what the business cares about most.
You can learn more by exploring different ways to measure marketing effectiveness across all your channels. The bottom line is simple: reliable data is non-negotiable for success. In the following sections, we'll break down exactly which metrics to track and how to ensure they're accurate.
Measuring Your Brand's Reach and Awareness

How far is your content really spreading? At the top of the funnel (TOFU), the name of the game is introducing your brand to new audiences and planting the seeds of authority. The metrics for content marketing at this stage are your radar, telling you just how well your content is capturing attention out in the wild.
These aren't just vanity numbers—they’re leading indicators of your future pipeline. Think of it this way: you can't have sales conversations tomorrow with people who don’t even know you exist today. Measuring reach and awareness tells you if that initial handshake with your market is firm and reaching far enough.
The Story Behind Your Traffic Numbers
Just looking at total pageviews can be dangerously misleading. A much smarter approach is to dig into where your traffic is coming from and what those visitors are doing. This uncovers the real story behind the numbers and tells you how people are discovering your brand.
Imagine a B2B software company that just published a new guide. They’d be laser-focused on these core awareness metrics:
- Unique Visitors: This tracks the number of distinct individuals who see your content. A steady increase here is a great sign that your brand's footprint is expanding.
- Traffic Sources: Are people finding you through organic search, social media, referrals, or by typing your URL directly? This tells you which channels are your heavy hitters and where you should double down on your investment.
- SERP Impressions: This is the number of times your content popped up in search engine results. It’s a pure measure of visibility and shows your presence in the market.
When you look at these metrics together, a clear picture emerges. High organic traffic points to strong SEO, while a sudden spike in referral traffic might mean you landed a great PR mention or backlink.
The real art of top-of-funnel measurement isn’t just counting visitors, but understanding the story of their arrival. For instance, a high impression count with a low click-through rate is a powerful signal that your content is visible, but your headlines and meta descriptions just aren’t compelling enough to earn the click.
From Impressions to First Clicks
Once your content gets in front of a potential customer, the next make-or-break metric is your click-through rate (CTR). This is the percentage of people who saw your content in search results and actually clicked to read it. It’s the critical bridge between visibility and genuine interest.
When it comes to grabbing that initial attention, visual formats are often king. Global video advertising spend shot past $190 billion in 2024 and is expected to break $200 billion in 2025—a huge testament to its power. For early-stage B2B companies, a healthy goal is often 3% to 10% month-over-month traffic growth, and compelling content is how you get there. You can dig into more on how different formats perform in these content marketing statistics.
Another key metric is Share of Voice (SOV). This estimates your brand's visibility against competitors for a specific set of keywords. Certain tools can help you track this, giving you a sense of your authority in the market. If your SOV is on the rise, you’re successfully becoming a more dominant voice in your industry’s conversation.
Alright, you've grabbed their attention. But are they actually interested? This is where content marketing metrics get really interesting, shifting from simply counting eyeballs to measuring genuine engagement. Reach tells you how many people saw your content; engagement metrics tell you how many people actually cared.
Think of it like hosting a party. Reach is the number of invitations you sent out. Engagement is the number of people who actually showed up, stuck around, and got into some good conversations. It’s the critical difference between a passive glance and an active participant.
Beyond the Click: Behavioral Metrics
To really understand if your content is hitting the mark, you have to look at what people do after the first click. These behavioral metrics tell a story. Without them, you’re flying blind, unable to tell the difference between a fleeting visit and a deep, meaningful read.
Here are the key indicators that separate a passive browser from an engaged reader:
- Average Time on Page: This is a direct signal of how captivating your content is. How long are people actually sticking around to read, watch, or listen?
- Scroll Depth: This tells you how far down the page a user went. Did they just skim the headline, or did they dive deep, consuming 75% or more of your article?
- Pages Per Session: Did a visitor check out other content on your site after landing on their first piece? A higher number here suggests they see your brand as a go-to resource.
- Social Interactions (Likes, Comments, Shares): While some dismiss these as vanity metrics, they can be a powerful signal that your content resonated strongly enough to inspire a public action.
The key is context. A five-minute time-on-page for a 4,000-word guide is a massive win. But that same five-minute duration on a simple landing page might signal friction or user confusion.
From Passive Reading to Active Intent
The most powerful signs of engagement come from specific user actions that show clear intent. These are best captured with event-based tracking, which monitors distinct interactions that go far beyond a simple pageview. These events are pure gold because they represent a user actively raising their hand to show they're interested.
An engaged user is one who moves from consuming content to interacting with it. Tracking these interactions—like a video play or a resource download—is how you move from measuring attention to understanding genuine audience intent.
This kind of detailed event tracking gives you a comprehensive view of how people are interacting with your site.
By monitoring specific events like newsletter_signup or video_play_start, you can see exactly which elements on your site are driving real engagement.
These actions are like micro-conversions, each one bringing a user one step closer to your main business goal. Key events to track for engagement include:
- Video Plays: How many people clicked play on your embedded videos?
- Resource Downloads: Are users downloading your whitepapers, case studies, or checklists?
- Newsletter Sign-ups: Is your content compelling enough to make someone want more of it in their inbox?
- Comment Submissions: Are you sparking a conversation?
Each of these actions is a vote of confidence. They signal that your content isn't just being seen—it's actively providing value, building trust, and moving people deeper into their journey with your brand.
Tracking Conversions and Lead Generation

While reach and engagement metrics tell you if people are paying attention, conversion metrics tell you if that attention is actually translating into business value. This is where your content starts paying the bills. Here, the focus shifts from simply capturing interest to driving real action—turning readers into tangible leads and customers.
Think of conversion metrics as the cash register of your content program. They directly measure how well your articles and guides persuade someone to take a high-intent action, like requesting a demo or starting a free trial. These are the metrics for content marketing that get the C-suite’s attention because they connect directly to pipeline and revenue.
Measuring High-Intent Actions
The most valuable conversions signal a user is moving from just considering solutions to actively making a decision. They are evaluating their options, and your content has successfully guided them toward yours. This is where you measure specific, high-stakes actions.
Key conversion metrics include:
- Lead Conversion Rate: The percentage of visitors who complete a high-value form on your content. This could be for a demo request, a sales consultation, or a free trial signup.
- Content-Attributed Leads: The raw number of new leads where a specific piece of content was a key touchpoint in their journey.
- Cost Per Lead (CPL): The total cost to create and promote a piece of content divided by the number of leads it generated. This shines a light on the efficiency of your content spending.
By tracking these, you can identify which content pieces are your most powerful sales assets. An in-depth guide that consistently brings in high-quality demo requests is far more valuable than a viral article that produces zero leads. You can explore the fundamentals of this process in our guide on what is conversion tracking.
The goal is to move beyond asking, "Did they read it?" and start asking, "Did it convince them to act?" This shift requires tracking not just consumption, but the decisive actions that signal buying intent.
Tracking the Journey From Blog Post to Sale
Let’s use a real-world example. Imagine an e-commerce brand that sells high-end blenders publishes a detailed product comparison, "The Ultimate Blender Showdown: Vitamix vs. Blendtec."
A potential customer reads this post, finds the comparison helpful, and clicks an internal link to the Vitamix product page. A few days later, they come back to the site, add the blender to their cart, and make the purchase. In this scenario, the blog post was a critical "assisted conversion." While it wasn't the final click, it played a vital role in the customer's decision.
This brings up the importance of attribution models. A first-touch model would give 100% of the credit to the blog post, whereas a multi-touch model would distribute the credit across all the touchpoints in the customer’s journey. The right model depends on your sales cycle, but both highlight the blog post’s immense value.
Don't Overlook Micro-Conversions
Not every valuable action is a final sale. Micro-conversions are smaller steps a user takes that indicate growing interest and move them further down the funnel. They are essential leading indicators of future macro-conversions.
For our e-commerce brand, a micro-conversion could be:
- Adding an item to the cart (even if they don't check out right away).
- Signing up for a "back in stock" notification.
- Downloading a recipe book that requires an email address.
Each of these actions is a signal of intent. Tracking them helps you understand the complete buyer's journey and optimize your content to nurture users from one step to the next. By measuring both macro and micro-conversions, you get a full, nuanced picture of how your content generates real business momentum.
Connecting Content to Revenue and ROI
While metrics like reach and engagement are important, they don't answer the one question every executive asks: "What's the return on this investment?" This is where we connect the dots between your content and the actual revenue it brings in. Proving Return on Investment (ROI) is how you show that content is a core business driver, not just a marketing expense.
This is the part where we move past proxy metrics and get straight to the bottom-line impact. It’s all about calculating how your articles, guides, and videos directly contribute to sales. For a lot of marketers, this is the toughest piece of the puzzle, mostly because of how hard it can be to trace revenue back to a specific piece of content.
The Formula for Content Marketing ROI
Calculating your content marketing ROI doesn't have to be some dark art. At its heart, the formula is surprisingly simple. You're just comparing the money your content made against what you spent to create and promote it.
Here’s the basic calculation:
Content Marketing ROI = ( [Revenue from Content - Content Cost] / Content Cost ) x 100
To make this work, you need two key numbers:
- Content Cost: This is the total investment. Think salaries for your team and freelancers, subscriptions for design and analytics tools, and any ad spend you used for promotion.
- Revenue from Content: This is the tricky one. It requires a solid tracking system that can follow a customer from their very first interaction with a blog post all the way to a closed deal.
The challenge isn't the math; it’s getting clean, reliable data. Without it, any ROI calculation is really just a shot in the dark.
Attributing Revenue and Assisted Conversions
It's rare for a customer to read a single blog post and immediately pull out their credit card. The customer journey is usually a winding road with multiple stops along the way. This is why revenue attribution is so critical—it’s the process of giving credit to the different marketing efforts that influenced a sale.
- Direct Revenue Attribution: This is the simplest scenario. A user clicks "Buy Now" straight from a product guide you wrote. It's easy to track but usually only tells a small part of the story.
- Assisted Conversions: This measures how often your content played a role somewhere in the customer journey, even if it wasn’t the final click. For example, a user might find your brand through a blog post, sign up for your newsletter a week later, and finally buy something from an email campaign. That blog post gets credit for an assisted conversion.
Top brands are seeing a median revenue return of 4.33:1 from their content. Yet, while 83% of leaders say proving ROI is a priority, only 36% feel they can measure it accurately. This gap is a huge opportunity. For performance marketers, content should be influencing 20% to 50% of the B2B sales pipeline or 10% to 30% of assisted B2C sales. You can find more on this in a recent report on content marketing ROI stats.
Measuring Customer Acquisition Cost and Pipeline Influence
Another powerful way to measure content's financial impact is by looking at its effect on your Customer Acquisition Cost (CAC). Is your content program bringing in leads more cheaply than your paid ad campaigns? If the answer is yes, then your content is creating serious financial leverage for the business.
You can figure out a content-specific CAC by dividing your total content costs by the number of new customers you acquired through your content. Comparing that number to your company's overall CAC will show you just how efficient your content is as an acquisition channel. Beyond content's direct ROI, learning from wider marketing efforts, such as the insights from a marketing budget experiment, can give you valuable ideas for optimizing your entire spend.
Finally, for B2B companies, tracking pipeline influence is a must. This means tagging leads in your CRM based on the content they've interacted with. This allows you to run reports showing exactly how many dollars in your sales pipeline were touched by your content. This metric proves to your sales and leadership teams that content isn't just generating leads—it's helping to close deals.
How to Fix Your Inaccurate Content Metrics
All the planning in the world won’t save a content strategy that’s running on bad data. It's the Achilles' heel of modern marketing: you make what you think are smart, data-driven decisions, but the numbers steering the ship are fundamentally broken.
Think of your analytics setup as a pipeline. When it's working, it carries clean, reliable data from your website straight to your reporting dashboards. But more often than not, that pipeline is riddled with tiny, invisible leaks, and each one contaminates the final output. These leaks are the data quality issues that quietly sabotage your metrics for content marketing.
The Leaky Pipeline of Inaccurate Data
These data leaks aren't usually big, obvious breaks. They’re the small, hidden errors that add up over time, slowly corrupting your reports and leading you to draw all the wrong conclusions. A single broken event can torpedo your entire conversion rate calculation, making a winning campaign look like a total flop.
Here are a few of the most common leaks we see poisoning analytics:
- Broken Tracking Codes: A developer pushes a small update, and suddenly your critical
form_submissionevent stops firing. You see leads drop to zero and assume the campaign failed, but people are still converting—you just can't see it anymore. - Inconsistent UTM Parameters: Your marketing team uses
utm_source=linkedinfor organic posts, but your paid media agency usesutm_source=LinkedIn. Your analytics tool now treats these as two completely different sources, fracturing your data and making it impossible to gauge the true ROI of your LinkedIn efforts. - Schema Mismatches: Your analytics tool expects a
priceproperty to be a number (like 99.99), but a recent code change now sends it as a string with a currency symbol (like "$99.99"). That one tiny mismatch can instantly break revenue reporting across your entire company.
These issues might seem minor on their own, but their consequences are huge. They create unreliable reports, erode trust in the data, and leave your team flying blind.
What if the data you're measuring isn't designed to serve your brand, but rather the platforms providing the metrics? This phenomenon, sometimes called "technoplasmosis," describes how we can be induced into mistaking a platform’s KPIs for our own. Fixing your data is the first step to reclaiming control.
Plugging the Leaks with Automated QA
For years, the only way to find these leaks was to perform painstaking, manual audits. This meant hours of clicking through every user flow, squinting at network requests in developer tools, and cross-referencing everything against massive spreadsheets. It was a tedious process that was often outdated the moment it was complete.
This is where a modern analytics QA and observability platform like Trackingplan changes the game. Instead of relying on manual spot-checks, it acts as an automated security guard for your data pipeline, continuously monitoring every single event in real-time. It automatically discovers your entire tracking implementation and validates it against your plan.
When something breaks, Trackingplan catches it instantly and alerts you.
Example Alert:
- Issue: The
newsletter_signupevent is suddenly missing itsemail_addressproperty. - Impact: You’re no longer capturing lead information from new subscribers.
- Action: The system sends an immediate notification to your marketing and dev teams via Slack, pinpointing the exact cause so they can fix it before it derails your reports.
This proactive approach means you’re no longer waiting for a C-level executive to point out that the dashboard "looks wrong." You find and fix issues before they ever affect a single business decision, ensuring your metrics for content marketing are always accurate. This safeguards your ROI calculations and empowers your team to deliver insights built on a foundation of trust.
Frequently Asked Questions About Content Metrics

As you dive deeper into content marketing, you’ll naturally run into some common questions about measurement. Let's clear up a few of the big ones so you can move forward with confidence.
What Are the Most Important Metrics for a B2B Content Strategy?
In the B2B world, you have to look past the vanity metrics. While top-of-funnel indicators like organic traffic are a nice starting point, the real story is told by metrics that signal genuine buying intent and directly feed the sales pipeline.
Focus your attention on these key performance indicators:
- Marketing Qualified Leads (MQLs) generated from things like guide downloads or webinar sign-ups.
- Content-attributed pipeline value, which shows you exactly how many dollars in your sales funnel were touched by your content.
- Engagement on high-intent pages such as case studies, pricing sheets, and detailed competitor comparisons.
At the end of the day, a single demo request that came from a deep-dive article is infinitely more valuable than a thousand social media shares on a surface-level post.
How Often Should I Review My Content Marketing Metrics?
There’s no one-size-fits-all answer here. The right review cadence depends entirely on the metric you’re looking at. The best approach is to set up a tiered schedule so you stay on top of performance without getting bogged down in the noise.
Here’s a solid framework to start with:
- Weekly Reviews: Keep an eye on top-of-funnel metrics like traffic, SERP impressions, and social engagement. This cadence helps you spot immediate trends and catch any sudden dips before they become a bigger problem.
- Monthly Reviews: Dig into mid-funnel metrics like lead generation rates and on-page conversions. A month gives you enough data to identify statistically significant patterns.
- Quarterly and Annual Reviews: This is the time to assess business-level metrics for content marketing, including ROI, content-influenced revenue, and customer acquisition cost. It aligns your content performance with the company's broader planning cycles.
Automated dashboards and real-time alerts are your best friends here. They help you monitor the daily health of your metrics while you save the deep-dive analysis for your scheduled reviews.
How Can I Prove the ROI of My Content Marketing Efforts?
Proving ROI comes down to one thing: connecting your content activities directly to revenue. It’s not always easy, but it’s possible with a clear process for tracking both your investments and your returns.
To prove the value of content, you must accurately connect every dollar spent to every dollar earned. The basic formula is: ([Revenue from Content - Content Cost] / Content Cost) * 100. This calculation is simple, but its accuracy depends entirely on clean, trustworthy data.
First, you need to track all your content-related costs—team salaries, freelance fees, tool subscriptions, you name it. Next, use a robust analytics setup with proper attribution models to measure the leads and sales originating from your content. A CRM is absolutely vital for following a lead's journey from their first blog post interaction all the way to a closed-won deal.
Because this whole process hinges on accurate data, an analytics QA tool becomes essential.
Every metric you track needs to be accurate and reliable. Trackingplan provides a single source of truth by automatically discovering and validating your entire analytics implementation in real time. Stop guessing and start trusting your data today.