
TL;DR:
- Effective analytics alerting relies on continuous configuration, threshold tuning based on real data patterns, and seamless integration with incident workflows to reduce noise and ensure quick response. Streaming evaluation offers near-instantaneous detection for real-time signals, while batch systems suit KPI monitoring and data quality checks more efficiently. Choosing the right platform depends on data architecture, incident response needs, and operational maturity, with ongoing management essential for maintaining signal quality.
When a tracking pixel breaks, a revenue metric nosedives, or campaign data stops flowing, your team’s ability to respond in minutes versus hours determines real business outcomes. Top analytics alert systems are the infrastructure that makes the difference, yet most teams either over-alert until notifications get ignored or under-configure until problems fester undetected. This guide cuts through both failure modes. You’ll find a structured evaluation framework, in-depth profiles of the leading alert monitoring platforms in 2026, a side-by-side comparison, and concrete recommendations matched to specific data environments.
Table of Contents
- Key takeaways
- Top analytics alert systems: how to evaluate them
- 1. Adobe Analytics alerts
- 2. Databricks SQL alerts
- 3. SigNoz metrics-based alerts
- 4. Microsoft Azure Monitor alerts
- 5. RisingWave streaming alert system
- 6. RudderStack with PagerDuty integration
- 7. Grafana alerting
- Side-by-side comparison of leading alert platforms
- Situational recommendations for choosing and using alert systems
- My honest take on where analytics alerting actually breaks down
- How Trackingplan strengthens your analytics monitoring
- FAQ
Key takeaways
| Point | Details |
|---|---|
| Match alerts to your data signals | Choose systems that support metric, log, event, and anomaly alert types suited to your actual data architecture. |
| Design thresholds around real behavior | Thresholds set without context cause alert fatigue; align them with actual system patterns and business cycles. |
| Streaming beats polling for urgency | Sub-second continuous evaluation outperforms scheduled batch checks when incident response time matters most. |
| Integrate alerts into incident workflows | Connecting alert platforms to tools like PagerDuty or Slack transforms notifications into coordinated response actions. |
| Account for data pipeline delays | Configure delay settings in your alert builder to avoid false positives triggered by incomplete data ingestion. |
Top analytics alert systems: how to evaluate them
Before you compare platforms, you need a consistent lens for evaluation. Not all alert systems serve the same function, and choosing the wrong one means you’ll either pay for capabilities you never use or hit a ceiling the moment your data complexity grows.
Alert type coverage is your first filter. The strongest platforms handle at least four distinct signal types:
- Metric alerts fire when a numeric value crosses a defined threshold (page load time, conversion rate, error count).
- Anomaly alerts use statistical models to flag deviations from expected patterns without requiring a fixed number.
- Query-based alerts run scheduled SQL or custom queries and trigger when results meet a condition.
- Log and event-based alerts react to specific occurrences in log streams or event pipelines.
Evaluation frequency shapes how fast you learn about problems. Batch-scheduled alerts might check every 15 minutes or once a day. Near-real-time systems evaluate continuously as data arrives. For marketing attribution and revenue tracking, the difference between a 1-minute check and a 6-hour check is often thousands of dollars.
Threshold configurability is where most implementations fall apart. Static thresholds (alert when X drops below 100) fail during weekends, holidays, or seasonal campaigns. Dynamic thresholds that adjust to historical patterns are far more reliable. Alert thresholds should reflect real system behavior, include current values versus expected ranges, and link to runbooks so responders know what to do immediately.
Notification and integration options determine whether an alert gets acted on. Email-only systems create bottlenecks. Look for Slack, Microsoft Teams, PagerDuty, and webhook support so alerts reach people in the tools they already use.
Alert management at scale includes deduplication (preventing the same alert from firing 50 times), throttling, muting windows, and history tracking. These are often afterthoughts in evaluation but become critical the moment you’re managing dozens of active alert rules.
Pro Tip: Before committing to any platform, configure one real alert and measure the time from threshold breach to notification delivery. Stated evaluation intervals and actual delivery latency are frequently different numbers.
1. Adobe Analytics alerts
Adobe Analytics ships a purpose-built alert builder that goes beyond simple threshold triggers. You can configure alerts based on changed percentages or specific data point values, set delay windows to account for how long your data takes to fully process, and define expiration dates so temporary campaign-specific alerts don’t run indefinitely.
The standout feature is alert preview, which estimates how many times an alert would have fired historically given your current configuration. That’s an underutilized capability. Most teams set a threshold, publish the alert, and discover two weeks later they’ve generated 300 notifications nobody read. Adobe’s preview lets you tune before you go live.
Anomaly detection is available with premium packages, adding statistical intelligence on top of manual thresholds. Alerts can be scheduled daily, weekly, or monthly. For organizations already embedded in the Adobe Experience Cloud, this integration depth makes it a logical starting point.
The limitation is that Adobe Analytics alerts are tightly scoped to Adobe’s own data layer. If your stack spans multiple platforms, you’ll need supplemental tooling for full coverage.
2. Databricks SQL alerts
Databricks SQL Alerts take a query-first approach to monitoring. You write a SQL query, define a condition on its result set, schedule when it runs, and configure who gets notified. The alert bundles all four components into a single manageable unit, which keeps alert logic transparent and auditable.
What separates this system from simpler database schedulers is production-grade operationalization. SQL Alerts integrate directly into Databricks Jobs pipelines, support Git versioning for alert definitions, and expose APIs for managing alerts at scale across large organizations. Notification destinations include email, Slack, PagerDuty, Microsoft Teams, and webhooks.
This matters enormously for data engineering teams that treat infrastructure as code. Instead of clicking through a UI to configure 40 alerts, you define them programmatically, version them, and deploy them like any other pipeline artifact.
The constraint is that Databricks SQL Alerts are optimized for scheduled batch evaluation. If you need sub-second detection on streaming data, you’ll want a complementary system. For KPI monitoring and data quality checks on warehouse data, few platforms match the depth here.
Pro Tip: Use Databricks SQL Alerts in combination with a streaming alert layer rather than replacing one with the other. Batch alerts catch data quality issues and KPI drift; streaming alerts catch real-time threshold violations.
3. SigNoz metrics-based alerts
SigNoz is an open-source observability platform with a metrics alerting system that data and engineering teams have adopted well beyond its original application monitoring context. The alert builder supports Query Builder, ClickHouse SQL, and PromQL, giving you three different ways to express the same condition depending on your team’s preferred tooling.
Metrics-based alerts evaluate on a configurable interval, defaulting to one minute, and apply conditions over rolling time windows. You can alert on average memory usage, P95 latency, error percentages, or any custom metric your instrumentation exposes. There’s also a “no data” alert condition, which fires when expected data stops arriving. That specific capability catches a common but often overlooked failure mode: a silent tracking breakage that produces no errors but also produces no data.
For teams running microservices or server-side event pipelines, SigNoz offers a tightly integrated alerting experience without requiring a separate monitoring stack.
4. Microsoft Azure Monitor alerts
Azure Monitor is the broadest alert system on this list in terms of signal coverage. Multiple alert types span platform metrics, custom metrics, log search queries, activity logs, smart detection, and Prometheus-compatible metrics. Each type has its own evaluation model and permission scope, which adds configuration complexity but also enables highly precise alerting across diverse Azure workloads.
Metric alerts evaluate at defined intervals using either native platform metrics or custom metrics your applications emit. Log search alerts run queries against resource logs on a schedule. Smart detection analyzes Application Insights telemetry and surfaces anomalies without requiring threshold configuration, making it useful for teams that want signal without tuning overhead.
The permissions model is notable. Alerts can be scoped to specific resources, resource groups, or subscriptions, and access controls determine who can create, modify, or silence alerts. For large enterprises with strict governance requirements, this matters a lot.
The trade-off is setup complexity. Azure Monitor rewards teams willing to invest in configuration. For smaller teams or those outside the Azure ecosystem, the overhead may outweigh the breadth.
5. RisingWave streaming alert system
Most analytics alert systems operate on a polling model: check the data every N minutes, compare against a threshold, fire if the condition is met. RisingWave inverts this architecture entirely.
RisingWave uses materialized views that update incrementally as new data arrives. Alerts evaluate continuously rather than on a schedule, enabling sub-second latency from threshold breach to notification. For streaming data contexts such as real-time user behavior tracking, live transaction monitoring, or IoT sensor feeds, this is a structural advantage over any polling-based alternative.
The practical implication is that a fraud detection rule or a revenue anomaly can trigger an alert within seconds of the underlying event, not minutes or hours later. For high-stakes monitoring where delay is expensive, this architecture represents a meaningful step forward from traditional systems.
RisingWave is a more specialized option. It fits teams already operating streaming data infrastructure who need alerting that matches the latency profile of their data layer.
6. RudderStack with PagerDuty integration
RudderStack approaches analytics alerting from the customer data pipeline side rather than the monitoring tool side. Its PagerDuty destination transforms analytics track calls into structured incident events, creating a direct path from a data event to an operational incident workflow.
Deduplication keys in the integration control how events update, resolve, or acknowledge existing PagerDuty incidents. This prevents the classic alert storm where a single underlying issue generates hundreds of duplicate notifications and renders an incident timeline unreadable. Instead, a single incident is created, updated as state changes, and resolved when the condition clears.
For analytics teams that need alerts to trigger cross-functional response, not just notify a single analyst, this kind of operational integration is critical. A broken checkout tracking event becomes a PagerDuty incident routed to the right team with the right context, rather than an email sitting in someone’s inbox.
7. Grafana alerting
Grafana’s alerting layer works across its full data source ecosystem, meaning the same alert interface covers Prometheus, Loki, Elasticsearch, PostgreSQL, and dozens of other backends. Alert rules are defined in terms of queries against any connected data source, evaluated at configurable intervals, and routed through a notification policy that maps alert conditions to specific contact points and escalation paths.
The threshold design guidance from Grafana’s own documentation is worth treating as a general best practice. Meaningful thresholds include the current observed value alongside the threshold value, reference runbooks for responders, and use labels to route alerts to the right team rather than broadcasting to everyone. Applied consistently, this approach dramatically reduces the alert fatigue that plagues organizations with large, poorly governed alert libraries.
Grafana also supports silencing, inhibition rules, and alert grouping, which are the tooling equivalent of good alert hygiene. You can suppress expected noise during maintenance windows, prevent lower-severity alerts from firing when a higher-severity condition is already active, and group related alerts into single notifications.
Side-by-side comparison of leading alert platforms
| System | Alert types | Evaluation frequency | Anomaly detection | Key integrations | Best for |
|---|---|---|---|---|---|
| Adobe Analytics | Metric, anomaly | Daily/weekly/monthly | Yes (premium) | Adobe Experience Cloud | Adobe-native teams |
| Databricks SQL | Query-based, metric | Scheduled (configurable) | Limited | Slack, PagerDuty, Teams, webhooks | Data engineering, KPI monitoring |
| SigNoz | Metric, no-data | Per minute (configurable) | No | Email, Slack, PagerDuty | Observability, microservices |
| Azure Monitor | Metric, log, activity, smart detection | Per minute to per day | Yes (smart detection) | Azure ecosystem, webhooks | Enterprise Azure environments |
| RisingWave | Streaming threshold | Sub-second (continuous) | No | Custom integrations | Streaming data architectures |
| RudderStack + PagerDuty | Event-based | Near-real-time | No | PagerDuty (deduplicated) | Incident operationalization |
| Grafana | Metric, log, multi-source | Configurable intervals | Partial | Prometheus, Slack, PagerDuty, OpsGenie | Multi-source, cross-team alerting |
Ease of use varies significantly across this group. Adobe Analytics and Grafana offer mature, documented UIs. Databricks SQL Alerts reward engineers who prefer code-first workflows. RisingWave requires streaming infrastructure expertise to set up but pays off in latency. Azure Monitor has the steepest learning curve, proportional to its breadth.
Scalability is strongest in Databricks (API and Git management), Azure Monitor (enterprise-grade resource scoping), and Grafana (alert as code via Terraform providers). For teams managing alerts at volume, programmatic management is not optional; it’s the only sustainable approach.
Situational recommendations for choosing and using alert systems
No single platform is the right choice for every data team. The decision depends on your data architecture, incident response process, and operational maturity.
When to prioritize streaming evaluation: If your core data signals come from event streams, real-time pipelines, or user behavior feeds where a 5-minute delay means missed revenue, streaming systems like RisingWave or Kafka-integrated alerting are the right fit. Streaming architectures close the latency gap that polling-based systems cannot overcome regardless of how frequently they check.
When scheduled batch alerts are sufficient: For warehouse-based KPI reporting, data quality validation, and business metric monitoring where hourly or daily checks match the decision cadence, SQL-based alerting through Databricks or a similar platform is more maintainable and auditable than a complex streaming setup.
Designing thresholds that don’t create noise:
- Base thresholds on observed historical patterns, not guesses.
- Add separate thresholds for weekday versus weekend behavior.
- Use rolling windows (past 7-day average) rather than fixed absolute values when seasonality is a factor.
- Always include delay settings when your data pipeline has known ingestion latency. Delay settings prevent false positives from partial data, a problem that causes teams to mute valid alerts after too many false triggers.
Integrating alerts into incident workflows: Connecting analytics alerts to PagerDuty or equivalent incident management tools is worth the setup cost. When an alert event becomes a tracked incident with an owner, a timeline, and a resolution record, you gain both faster response and a historical record of how your data environment fails.
Pro Tip: If budget is a constraint, Grafana OSS plus a free-tier PagerDuty or Slack integration covers a significant portion of what commercial platforms offer for metric and log alerting. The gap is anomaly detection and managed infrastructure.
For teams focused on marketing campaign monitoring, the combination of anomaly detection and real-time notification channels is particularly high value, since campaign performance issues compound quickly when undetected. Analytics teams managing attribution data should also consider how anomaly detection in marketing can surface subtle drift in data quality before it corrupts downstream reports.
When analytics drives ROI, the systems that protect data accuracy become as strategically important as the analytics platforms themselves.
My honest take on where analytics alerting actually breaks down
I’ve worked with enough data teams to know that the platforms rarely fail people. The people fail the platforms by skipping the hard configuration work.
The most common pattern I’ve seen is a team that deploys a capable alert system, uses default thresholds, and within three weeks starts ignoring the notification channel because 80% of alerts are noise. That’s not a tool problem. It’s a discipline problem dressed up as a tooling complaint.
What I’ve learned is that effective alerting requires treating alert configuration as ongoing product work, not a one-time setup task. Your business changes. Your data patterns shift. A threshold that was meaningful in January is misleading by Q3. Teams that schedule quarterly alert reviews, the same way they review dashboards, consistently get better signal than teams that treat alert setup as a fire-and-forget exercise.
The other lesson I’d push hard on: invest in the incident workflow integration early, not as an afterthought. When an alert fires and nobody knows who owns the response or what the expected resolution path is, you lose the organizational trust that makes alerting valuable. An alert that fires into a shared Slack channel with no routing or ownership is noise by another name.
I’m genuinely excited about continuous streaming evaluation as it matures. The mental model shift from “checking every minute” to “evaluating the instant data arrives” is significant, and the latency advantages are real for high-stakes monitoring contexts. But most organizations aren’t ready for the infrastructure complexity streaming requires, so the near-term priority for most teams is getting threshold discipline and incident integration right on the platforms they already have.
— David
How Trackingplan strengthens your analytics monitoring
If your alerting gaps trace back to data quality problems upstream, a dedicated monitoring layer built for digital analytics environments makes a measurable difference.
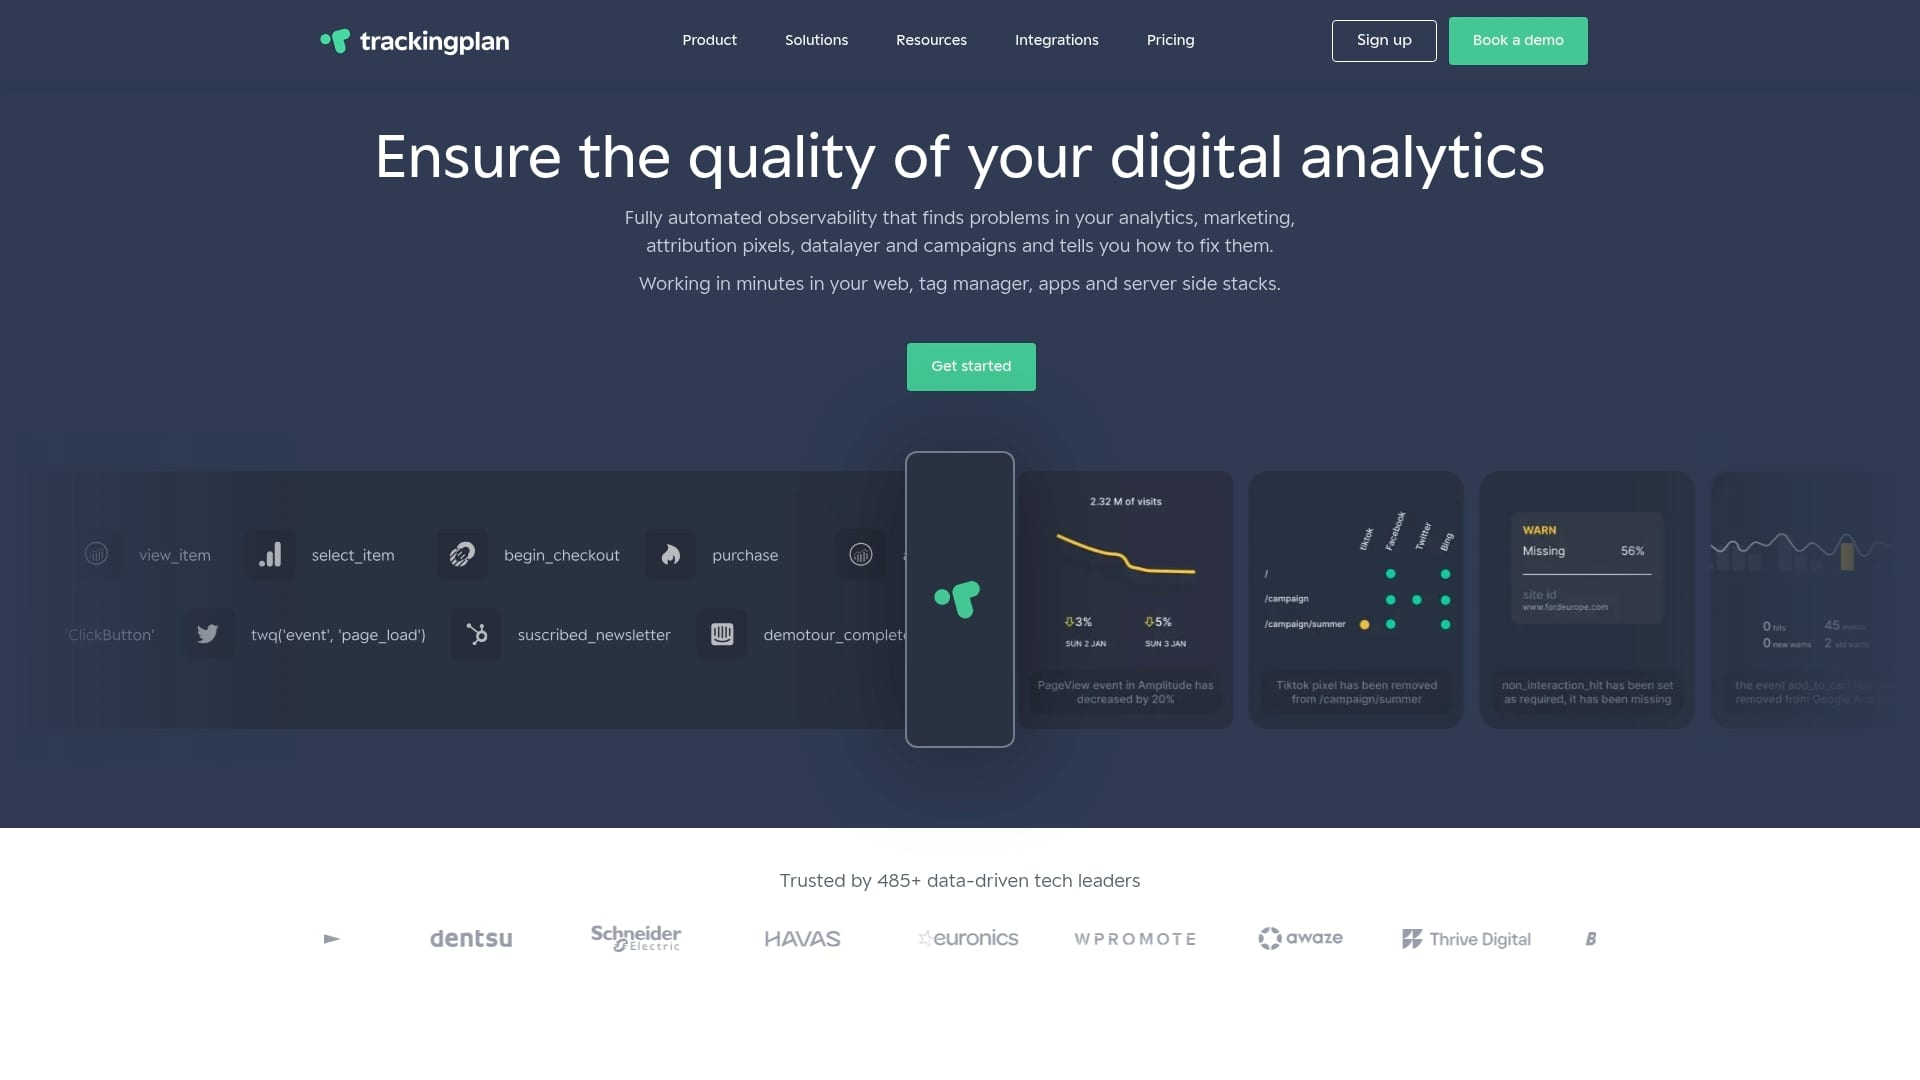
Trackingplan monitors your analytics implementation continuously, detecting tracking errors, broken pixels, schema mismatches, and campaign misconfigurations before they corrupt your data. Alerts fire via email, Slack, or Microsoft Teams the moment an anomaly or failure is detected, giving your team the context needed for rapid diagnosis rather than a generic “something’s wrong” notification.
For teams managing multiple sites, apps, or client environments, Trackingplan’s digital analytics monitoring integrates with the platforms you already use and surfaces issues with the specificity your team needs to act. The result is fewer false positives, faster resolution, and analytics data you can trust for attribution and spend decisions. Learn more about how it works and see where it fits your monitoring stack.
FAQ
What makes an analytics alert system effective?
An effective alert system delivers timely, specific, and actionable notifications tied to real data behavior. The combination of configurable thresholds, anomaly detection, and direct integration with incident workflows separates high-signal alerting from notification noise.
How do I reduce alert fatigue in my data team?
Design thresholds based on observed historical patterns, use delay settings to account for data ingestion latency, and implement deduplication to prevent repeated notifications for the same underlying issue. Quarterly threshold reviews keep alert rules aligned with current data behavior.
When should I use streaming alerts instead of scheduled ones?
Use streaming evaluation when your data arrives continuously and response time within seconds or minutes determines business impact, such as fraud detection, real-time revenue tracking, or live user behavior monitoring. Scheduled batch alerts are sufficient for warehouse KPI monitoring and daily reporting quality checks.
Can analytics alert systems integrate with incident management tools?
Yes. Platforms like Databricks, SigNoz, and RudderStack support direct integration with PagerDuty, Slack, and Microsoft Teams. Deduplication keys in PagerDuty integrations prevent alert storms by grouping related events into a single managed incident.
What alert types should a data team prioritize?
Start with metric alerts for quantitative KPIs, add anomaly alerts for signals with variable baselines, and layer in query-based alerts for data quality validation. A “no data” alert condition, available in platforms like SigNoz, catches silent tracking failures that produce no errors but also no usable data.