Anomaly detection in marketing: boost campaign results
Learn how anomaly detection in marketing catches broken pixels, protects ad spend, and boosts conversions by 10-20% with automated monitoring and real-time alerts.
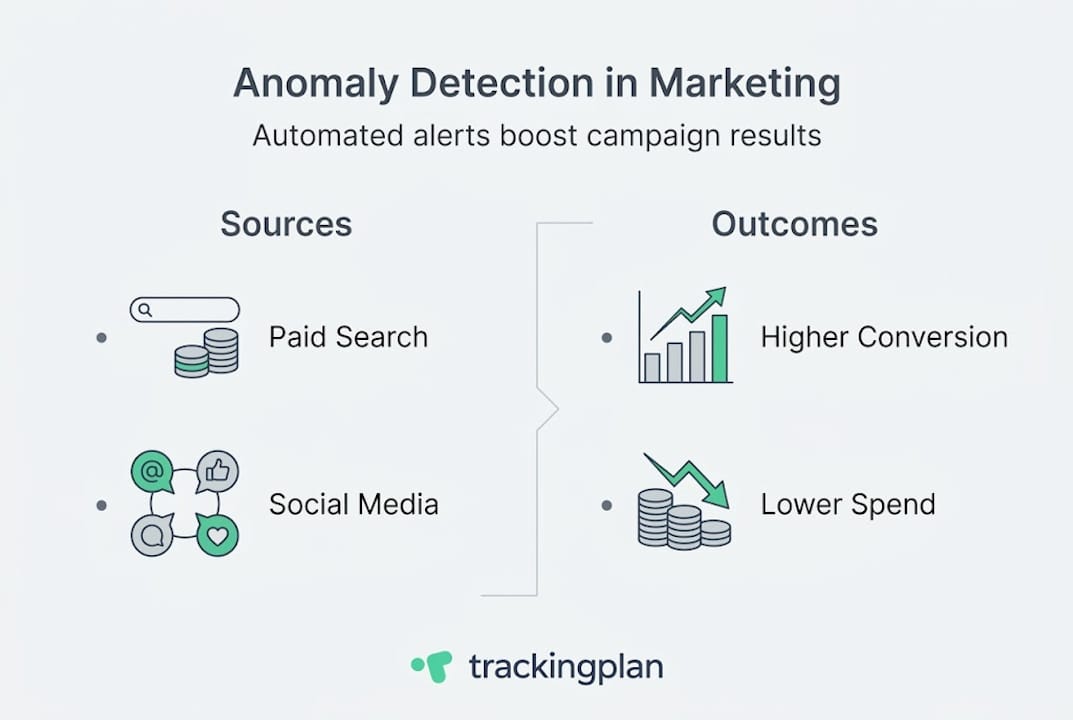
It leads to 10-20% more conversions and reduces wasted ad spend by preventing data issues.
Proper implementation involves regular review, customization, and clear response workflows for optimal results.
Anomaly detection in marketing: boost campaign results
A single data anomaly left undetected for even a few hours can trigger a 15% or greater drop in conversions before your team even notices something is wrong. Yet most marketing teams still rely on manual dashboard checks, scheduled reports, and gut instinct to catch problems. That approach worked when campaigns were simpler and traffic patterns were predictable. Today, with paid media budgets stretching across dozens of channels, seasonal spikes, and complex attribution chains, it simply is not fast enough. This article breaks down what anomaly detection actually means for marketing teams, which methods and platforms deliver real results, and exactly how you can put it to work on your campaigns starting now.
Key Takeaways
Point
Details
Proactive campaign protection
Automated anomaly detection catches data and conversion issues before they impact ROI.
Dynamic, AI-powered monitoring
Machine learning adjusts to changing baselines, outperforming old static thresholds.
Proven business impact
Marketers see conversion lifts of 10–20% and lower acquisition costs by up to 25%.
Seamless integration
Major analytics tools now support out-of-the-box anomaly alerts for fast adoption.
What is anomaly detection in marketing?
Anomaly detection in marketing is the automated process of identifying data points, patterns, or events that fall outside the expected range for a given metric. Think of it as a 24/7 data quality watchdog that never sleeps, never goes on vacation, and never misses a Tuesday afternoon traffic crash while your team is in a planning meeting.
At its core, this is about marketing data analysis that goes beyond spreadsheet comparisons. Instead of a human eyeballing a chart and noticing that click-through rate dropped this week versus last week, an anomaly detection system continuously compares live data against statistically derived expectations. When reality diverges from expectation by a meaningful margin, it fires an alert.
The typical data pipeline works in four stages. First, data is collected from every active marketing channel: paid search, social ads, email, organic, affiliate, and server-side tracking events. Second, that raw data is cleaned and transformed to remove noise, duplicates, and formatting inconsistencies. Third, the system establishes a dynamic normal range using historical data, seasonality patterns, and statistical methods. Fourth, AI and machine learning algorithms scan incoming data for outliers. As noted in core mechanics research, this involves data collection from marketing channels, cleaning and transformation, establishing dynamic normal ranges using historical data, seasonality, and statistical methods such as mean and standard deviation, then applying AI/ML algorithms to detect outliers.
The emphasis on dynamic baselines is important. A static threshold that flags anything below 500 daily conversions will produce endless false positives during a summer slowdown and miss a real crisis if your average usually runs at 2,000. Dynamic thresholds flex with your data patterns. They account for Monday versus Friday traffic differences, holiday shopping surges, and the natural ramp-up after a major campaign launch.
The main anomaly types you need to monitor include:
Sudden spikes: A traffic surge that could signal a viral moment, bot attack, or a misconfigured campaign suddenly buying impressions at 10x the normal rate
Sudden drops: Conversion rate or session count falling off a cliff, often caused by a broken pixel, a payment gateway error, or a tracking tag that fired incorrectly after a site update
Persistent deviations: A metric that is consistently 8% below baseline for two weeks, suggesting a creeping problem like audience fatigue or a landing page underperforming
Broken tracking: Missing events, duplicate events, or schema mismatches that corrupt your attribution data entirely
Fraud signals: Abnormal click patterns, impossibly fast session durations, or geographic clusters inconsistent with your targeting
For marketers, the real value is speed. When a pixel breaks at 9 a.m. on a Monday and your anomaly detection system alerts you by 9:15 a.m., you lose maybe an hour of clean data. Without automated detection, that same pixel can sit broken for days, silently corrupting your attribution reports and sending your optimization algorithms chasing ghost conversions.
Pro Tip: Do not wait until end-of-month reporting to discover tracking issues. Configure anomaly detection alerts on your core conversion events and check them daily at minimum. Even a 4-hour gap in conversion tracking can shift your automated bidding strategies in the wrong direction and waste significant budget.
Key methodologies and popular tools
Understanding which method powers your anomaly detection matters because different approaches have different strengths, blind spots, and computational costs. What works beautifully for a smooth e-commerce revenue trend may completely miss anomalies in noisy, bursty social ad spend data.
Here are the four core methodologies used in modern marketing analytics:
Z-score (statistical baseline): Calculates how many standard deviations a data point is from the mean. Fast, simple, and interpretable. Works well for stable metrics with predictable variance. Struggles with seasonal data or when the distribution is not normal.
ARIMA (AutoRegressive Integrated Moving Average): A time-series model that accounts for trends and seasonality. Much better than Z-score for cyclical marketing data like weekly email open rates or monthly organic traffic. Requires clean historical data and some tuning.
Isolation Forest: A machine learning algorithm that isolates anomalies by randomly partitioning data. Excellent for high-dimensional marketing data sets where multiple metrics interact. It works on the principle that anomalies are few and different, so they isolate faster in a random tree structure.
Autoencoders: Neural networks trained to compress and reconstruct normal data patterns. When they fail to reconstruct a data point accurately, that point is flagged as anomalous. Best for complex, high-volume data streams like server-side event tracking, but requires significant training data and compute resources.
Major platforms have embedded these methods into their products. Google Analytics uses Bayesian state space-time series models with a 90-day training window for daily anomalies. Adobe Analytics anomaly detection uses time-series models, regression, and the GESD (Generalized Extreme Studentized Deviate) test for weekly and monthly data, with specific adjustments for holidays. Both platforms allow you to review anomalies in their interfaces, though neither sends proactive real-time alerts by default.
For teams working directly in data warehouses, anomaly detection in BigQuery using ML.DETECT_ANOMALIES and ARIMA_PLUS models gives you full control over training periods, confidence levels, and which metrics to monitor. The tradeoff is that it requires SQL and data engineering skills most marketing teams do not have in-house.
GA4 has improved its built-in capabilities significantly. GA4 anomaly detection surfaces unusual changes in the Insights panel automatically, but the detection cadence and alert thresholds are not fully customizable for marketers who need to monitor specific paid campaign KPIs.
Method
Best for
Pros
Cons
Z-score
Stable, low-variance metrics
Fast, easy to understand
Poor with seasonality
ARIMA
Cyclical marketing data
Handles trends and seasons
Requires historical data
Isolation Forest
Multi-dimensional data sets
Works with complex data
Less interpretable
Autoencoders
High-volume event streams
Catches subtle patterns
Needs large training sets
For context, the history of Google Ads illustrates how quickly the paid media landscape has grown in complexity, making automated detection increasingly essential for any team managing campaigns at scale.
Proven benefits and real-world results
The business case for anomaly detection is not theoretical. Real teams are recovering real revenue with it. The numbers are compelling enough that any marketing leader should be asking why they do not have this in place already.
On the performance side, empirical benchmarks show a 10 to 20% increase in conversions, 15 to 25% reduction in acquisition costs, analysis time reduced by 70%, and campaign performance improvements of 20 to 30% after implementing automated anomaly detection. These are not best-case projections. They reflect what teams actually measure after switching from manual monitoring to automated systems.
Two case examples make the stakes concrete:
Quantum Metric detected a 15% sudden drop in conversions through automated monitoring. Because the alert fired within minutes, the team diagnosed and resolved a checkout flow glitch quickly, ultimately recovering 25% of the conversions that would have been lost under manual monitoring.
An Adobe Analytics retailer caught a pricing display glitch through anomaly detection before it could fully propagate across the site. The rapid response prevented what was later estimated to be $1.5 million in lost revenue. Without automated detection, that glitch could have run through an entire weekend before anyone pulled a Monday morning report.
Key performance improvements teams report after implementing anomaly detection:
Faster time-to-resolution on tracking issues, from days to hours or minutes
Cleaner attribution data that produces more reliable ROAS calculations
Reduced wasted ad spend caused by campaigns optimizing against broken conversion data
Earlier detection of creative fatigue, allowing faster creative refreshes
The conversion rate in advertising is already notoriously difficult to improve through creative and targeting optimizations alone. Getting a 10 to 20% lift purely by ensuring your tracking and data quality are intact represents some of the highest ROI work a marketing team can do.
When it comes to measuring ROI from your anomaly detection investment, the formula is straightforward. Calculate the average revenue or conversions lost during your last three major tracking incidents before automated detection. Multiply by the expected reduction in detection time. That delta is your baseline savings, before you account for the ongoing performance improvements from cleaner data feeding your bidding algorithms. Teams that track customer acquisition impact carefully often find that data quality monitoring delivers faster payback than most channel optimization experiments.
The timing of measurement matters too. ROI from anomaly detection compounds over time. In the first month, you primarily see savings from catching acute incidents. After six months, you start seeing the downstream effect: better-calibrated automated bidding, more reliable A/B test results, and attribution models that actually reflect real customer journeys.
Best practices for implementation and action
Knowing anomaly detection works is one thing. Getting it running properly in your analytics stack is another. Most teams that struggle with implementation do not fail because the technology is hard. They fail because they set it up once and never revisit the configuration as their campaigns evolve.
Here is a practical step-by-step process for implementing anomaly detection that actually sticks:
Audit your current tracking setup. Before you can detect anomalies, you need to know what normal looks like. Run a full inventory of every tracking event, pixel, and conversion action currently firing across your properties. If your baseline data is corrupted, your anomaly models will be too.
Integrate with your core analytics platforms. Connect Google Analytics, Adobe Analytics, or your data warehouse to your anomaly detection layer. For real-time alerts on pacing, CPA, and conversions, direct integration with your paid media platforms is essential, not optional.
Set dynamic baselines, not static thresholds. As discussed earlier, static thresholds are a false economy. Use your platform’s training period to establish baselines that account for your specific seasonality and campaign cycles. Most platforms recommend at least 90 days of clean historical data for reliable baselines. This is why auditing your tracking setup first is so important.
Prioritize your most business-critical metrics. Do not try to monitor everything at once. Start with your primary conversion events, your core paid media cost metrics, and your highest-traffic acquisition sources. Add secondary metrics after you have calibrated alerts on the essentials.
Configure escalation workflows. Not every anomaly deserves a 2 a.m. text message. Map your anomalies by severity: critical alerts (conversion tracking down, budget pacing 200% above target) go to Slack and SMS immediately. Warning-level anomalies (a metric 15% below baseline for 3 consecutive hours) can go to a daily digest email. Reference your data monitoring best practices to build escalation tiers that your team will actually follow.
Build a response playbook. Every major anomaly type should have a corresponding diagnostic checklist. Conversion drop? Check pixel status, check landing page load time, check payment gateway. Traffic spike? Check referral sources, check bot filter logs, check campaign pacing. A documented playbook turns a stressful incident into a manageable process. Your campaign tracking checklist is a good starting point.
Review and recalibrate quarterly. Your campaigns change. Your baselines should change with them. Schedule a quarterly review to adjust thresholds, add new conversion events, and remove metrics that are no longer relevant. Teams that skip this step end up with alert fatigue as the system cries wolf on normal campaign behavior.
Pro Tip: The biggest source of alert fatigue is not setting sensitivity too high. It is failing to update your baselines after a major campaign launch or site redesign. When your traffic patterns shift permanently, your anomaly detection system needs to learn the new normal. Give it a fresh 30-day baseline window after any major change and follow established to keep your setup aligned with real campaign behavior.
For teams managing multiple clients or properties, the configuration workload multiplies fast. This is where purpose-built platforms that centralize alert management across properties become critical for maintaining sanity without hiring an army of analysts.
What most marketers miss about anomaly detection
Here is the uncomfortable truth: most marketing teams implement anomaly detection, declare victory, and then quietly go back to manual monitoring within a few months. Not because the technology failed them. Because they treated it like a product launch rather than a process change.
The first major pitfall is over-reliance on default tool settings. Both Google Analytics and Adobe Analytics ship with anomaly detection turned on, which convinces teams they are covered. But default settings are calibrated for a generic user base, not your specific campaign structure, seasonality, or conversion funnel. Using defaults without customization is like wearing a one-size-fits-all safety harness: technically present, practically unreliable.
The second pitfall is organizational. Anomaly detection alerts only help if someone is empowered to act on them immediately. We have seen teams where alerts fire correctly but sit in an email inbox unread because no one clarified who owns the response. Cross-team alignment between marketing, analytics, and engineering is not optional. It is the difference between a 15-minute fix and a 15-hour disaster. Teams that prioritize marketing over analytics often discover this the hard way when a clean alert goes unresolved because nobody claimed ownership.
The third pitfall is ignoring context when interpreting alerts. A 40% traffic spike could be the beginning of a viral moment or the start of a bot attack. Without context layers like campaign schedule data, known industry events, and historical pattern comparisons, every spike looks like a threat. Train your team to investigate before reacting.
The opportunity most teams miss is using anomaly detection proactively, not just reactively. Instead of waiting for something to break, use your anomaly insights to build smarter campaign pacing rules, identify creative fatigue earlier, and flag audience segments that suddenly behave differently. Anomaly detection is not just a fire alarm. It is a signal generator for continuous optimization.
Ready to automate marketing anomaly detection?
Every insight in this article points to the same conclusion: manual monitoring cannot keep pace with modern marketing complexity. You need automated systems that watch your data continuously and alert you the moment something breaks or drifts out of range.
Trackingplan is built specifically for this problem. It gives marketing and analytics teams automated discovery, real-time alerts, and root-cause analysis across every channel in your Martech stack, without requiring a data engineering team to set it up. Whether you are monitoring web pixels, server-side tracking, or cross-channel attribution, Trackingplan flags issues before they corrupt your data or waste your budget.
Explore how Trackingplan integrates with your existing digital analytics tools to deliver automated anomaly alerts directly to Slack, email, or Teams. Or see how web tracking monitoring can give your team a live view of tracking health across all your properties. Start protecting your campaign data today.
Frequently asked questions
What is a marketing anomaly in analytics?
A marketing anomaly is any unexpected spike, drop, or unusual pattern in your campaign data that deviates from historical trends. Detection systems flag outliers by continuously comparing live data against dynamically established normal ranges.
Which platforms have built-in anomaly detection for marketing data?
Google Analytics and Adobe Analytics both include native anomaly detection that uses advanced time-series models and machine learning. Both platforms apply platform-specific approaches that account for seasonality and holidays, though customization options are limited by default.
What’s the difference between static and dynamic thresholds for anomaly detection?
Static thresholds use a fixed value that triggers an alert regardless of context, while dynamic thresholds adjust based on historical patterns and seasonal trends. Dynamic normal ranges are far more effective for paid campaigns where traffic and conversion volumes fluctuate naturally by day, week, and season.
How does anomaly detection improve marketing ROI?
It automates the flagging of data issues that silently erode campaign performance, resulting in 10 to 20% more conversions and up to 25% lower acquisition costs in documented benchmarks. Clean data also improves automated bidding accuracy, compounding the ROI over time.
Can anomaly detection help spot broken tracking in real time?
Yes. Automated systems identify conversion-impacting tracking issues within minutes of occurrence, preventing the hours or days of data loss that would happen with manual monitoring. Catching a broken pixel in real time versus the next morning review can mean the difference between minutes and a full day of lost attribution data.
David Pombar
Read more from David, a Senior Product Strategist with 18+ years in digital product development and an atypical error detection knack.
By clicking “Accept All Cookies”, you agree to the storing of cookies on your device to enhance site navigation, analyze site usage, and assist in our marketing efforts. View our Privacy Policy for more information.