Discover how to diagnose and fix web page errors that corrupt analytics data. Our guide offers proven strategies to maintain data accuracy and protect your ROI.
Web page errors are the gremlins in your website’s machinery. They’re the glitches that break functionality, corrupt analytics data, and quietly sabotage your business goals. These problems range from the glaringly obvious, like a 404 Not Found page, to silent failures in tracking scripts that go completely unnoticed.
These aren't just minor tech issues. They directly impact user experience and the business intelligence you rely on, making it critical to find and fix them fast.
The True Cost of Web Page Errors
Picture this: you’ve just launched a high-stakes marketing campaign. The ad spend is climbing, but your conversion dashboard is flatlining. Strange.
You check the landing page, and everything looks perfect. The design is clean, the form loads, and the checkout button is right where it should be. But behind the scenes, a single, invisible web page error is stopping the "purchase complete" event from ever reaching your analytics.
For the customer, the transaction went through just fine. For your business, it’s a catastrophic data failure. Your analytics platform never got the signal, making it impossible to measure ROI, attribute sales correctly, or optimize the campaign. This isn't just a technical hiccup; it's a blind spot that undermines your entire strategy.
More Than Just Broken Links
When most people hear "web errors," they think of the obvious stuff—a 404 page or a broken image. But the most dangerous issues are the ones you can’t see. These silent failures corrupt your data integrity and erode user trust, all without raising any red flags.
And this problem is far more widespread than you might think. In a single month, monitoring services recorded over 11 million HTTPS errors around the world. Digging deeper, about 25% of all webpages that existed between 2013 and 2023 are no longer accessible. Even more staggering, 38% of pages from 2013 are now completely gone. For teams that depend on analytics, these errors mean inconsistent data collection and dashboards you can't trust. You can explore more about this digital decay and its impact on information access.
A reactive approach to debugging is a losing game. By the time you manually spot a data anomaly in your reports, the damage is already done—revenue has been lost, user trust has been damaged, and strategic decisions have been based on faulty information.
The Ripple Effect Across Your Organization
When analytics data is unreliable, the consequences ripple through every department. Marketing teams can't justify their budget, product managers make decisions based on incomplete user behavior, and executives lose confidence in the reports they’re given.
We can group these errors into several "families," each with its own unique impact:
- HTTP Status Code Errors: These are server-level problems, like the infamous 404 or a 500 server error. They often stop users from even accessing your content in the first place.
- JavaScript Runtime Errors: These client-side issues break interactive elements like "Add to Cart" buttons or payment forms, directly blocking conversions.
- Resource Load Failures: Missing images, stylesheets, or scripts degrade the user experience and can completely break how a page works.
- Analytics Tracking Errors: These are the silent killers. They fail to capture user interactions, poisoning your data streams without any visual cues.
To make this clearer, let's break down how these errors cause real-world problems for different teams.
How Common Web Page Errors Impact Business Operations
The table below connects specific error types to the tangible business problems they create, highlighting which teams feel the pain most acutely.
As you can see, a single technical error is never just a technical problem. It’s a business problem that can undermine strategy, waste budget, and lead to poor decision-making across the entire organization.
A Practical Guide to Different Types of Web Page Errors
Web page errors aren't a single, monolithic problem. They're a diverse family of issues, each with a unique cause and impact. To fix them effectively, you first need to understand what you’re looking at.
Think of it like a doctor distinguishing between a broken bone, a common cold, and a high-stakes emergency—each requires a completely different treatment plan. These seemingly technical glitches create very real business problems.
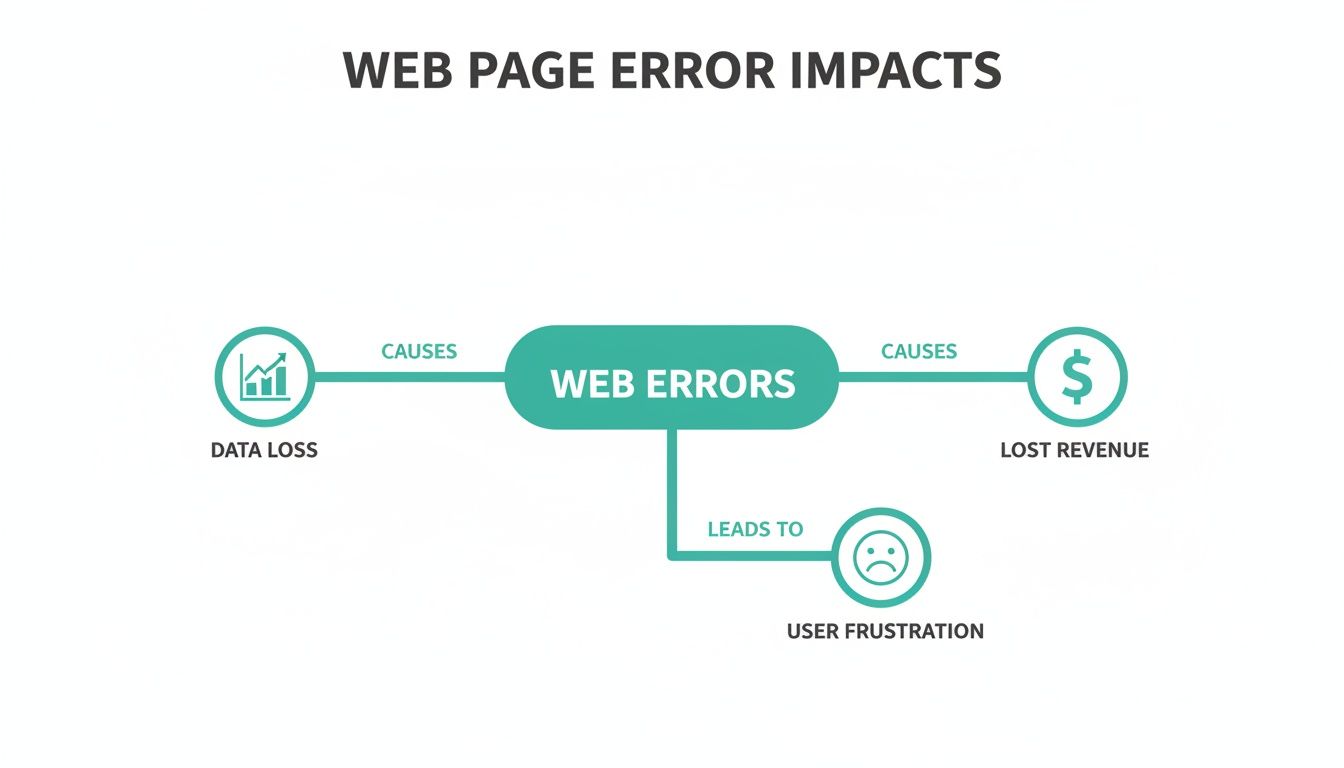
As you can see, every error ultimately leads back to one of three negative outcomes: data loss, lost revenue, or user frustration.
Server and Client Communication Errors
The most common errors pop up when the conversation between a user's browser (the client) and your website's server breaks down. We categorize these with HTTP status codes, which are like quick, standardized updates on how a request is going.
Imagine you're ordering a pizza. A couple of the most familiar errors would play out like this:
- 404 Not Found: You call the pizza place and ask for a "pineapple and anchovy calzone," but they tell you, "Sorry, we don't have that on our menu." That’s a 404 error. The server understood your request but couldn't find the specific page you wanted.
- 500 Internal Server Error: You call the same place, but the moment you start your order, the oven explodes and the phone line goes dead. That’s a 500 error. The server got your request, but a major internal problem—the exploding oven—prevented it from being fulfilled.
These server-level issues are roadblocks that often stop users from even seeing your content. They can include common technical issues like slow loading times and interactivity problems, often identified through understanding Core Web Vitals and page experience errors.
While a 404 might just frustrate a user, a persistent 500 error can signal a deep-seated problem with your website's infrastructure, potentially taking your entire site offline and costing significant revenue.
Client-Side JavaScript and Resource Errors
Once the server successfully sends the page to the browser, a whole new set of potential problems can emerge right on the user's device. These are client-side errors, often caused by the very code that makes your site interactive and visually appealing.
JavaScript (JS) errors are a prime example. Think of JavaScript as the assembly instructions for a product. If a step is missing or written incorrectly, the final product won't work. On a website, a JS error could mean an "Add to Cart" button that does nothing when clicked or a contact form that simply refuses to submit.
Another common client-side issue is a resource loading failure. This happens when the browser can't fetch essential files like images, stylesheets (CSS), or other scripts. It’s like a chef trying to make a meal but discovering key ingredients are missing; the final dish will be incomplete and unappealing, leading to broken layouts and a terrible user experience.
The Silent Killers: Analytics Tracking Errors
Finally, we get to the most deceptive—and often most damaging—category of web page errors. Analytics tracking errors are silent killers because they almost never cause a visible problem for the end-user. The page loads, the buttons work, and everything appears perfectly normal.
But behind the scenes, the tracking pixels and analytics events that are supposed to capture user behavior are failing to fire. The purchase_complete event is never sent, the sign_up interaction is missed, and your campaign attribution data is lost forever.
This is the digital equivalent of a security camera that looks like it's working but isn't actually recording. You think your assets are being monitored, but in reality, you have massive blind spots. These errors make your data completely unreliable, leading to flawed business decisions based on bad information. They are the true silent killers of any data-driven strategy.
How to Manually Investigate Web Page Errors
When you suspect something’s gone wrong on your site, you don’t have to sit back and wait for the user complaints to start rolling in. You can be the first responder and run a quick diagnosis yourself. The best part? The most essential tools for the job are already built right into your web browser.
Playing detective with your website’s code might sound a bit intimidating, but it’s far more accessible than you’d think. By learning just a few basic steps, you can start to uncover the root causes behind many common web page errors. This hands-on approach empowers you to find the "smoking gun" and truly understand why automated monitoring is so vital for catching everything else.

This image shows the browser's Developer Tools, a powerful suite for debugging web pages directly within browsers like Chrome. It provides panels for inspecting elements, analyzing network traffic, and, most importantly, identifying errors in the Console.
Uncovering Clues in the Browser Console
Think of your browser's Developer Tools (or "DevTools") as your primary investigation kit. You can usually open them by right-clicking anywhere on a webpage and hitting "Inspect," or by using a keyboard shortcut like F12 or Ctrl+Shift+I. Once you’re in, your first stop should always be the Console tab.
The Console is basically a real-time log of what your website is doing behind the scenes. When a piece of JavaScript code breaks or just plain fails to run, it spits out an error message right here. These messages, often highlighted in an angry red, are direct clues that can point you to the source of the problem.
For example, you might see something like Uncaught TypeError: Cannot read properties of null. This might look cryptic, but it tells a developer that the code tried to do something with a page element that doesn't actually exist. This could be the exact reason your "Sign Up" button isn't working. Grabbing a screenshot of these messages is incredibly helpful when you report the issue to your development team.
Analyzing Traffic with the Network Tab
While the Console is fantastic for script-related issues, the Network tab is where you investigate how your site's resources are loading. This tab shows every single request your browser makes to build the page—from images and stylesheets to API calls and tracking pixels.
Each request is listed along with an HTTP status code. Just by scanning this list, you can spot problems in a heartbeat:
- Status 404: This means a file is missing. You might see a crucial image or CSS file that failed to load, which would perfectly explain why your page layout is all messed up.
- Status 500: A server error here confirms the problem isn't on the user's end but with your backend. That's a critical insight that tells you exactly which team needs to be alerted.
The Network tab is also where you can confirm if your analytics tags are firing correctly. By filtering the requests, you can check if calls to Google Analytics, Segment, or other marketing platforms are actually going through. If a key conversion event is missing from this list, you've just found a major hole in your data collection.
Using Browser Extensions for Tag Verification
Beyond the built-in DevTools, there are several browser extensions designed specifically to make checking analytics and marketing tags a breeze. These tools give you a much friendlier interface for verifying that your pixels are implemented correctly and firing when they should.
Extensions like the Google Tag Assistant or the Meta Pixel Helper can show you exactly which tags are active on a page, what data they’re collecting, and if they’ve run into any errors. This gives you a quick and easy way to spot-check high-priority pages, like your checkout flow or lead forms, without having to dig deep into the Network tab.
While these manual methods are powerful for on-the-spot debugging, they all share one huge limitation: you can only check one page at a time. It’s simply impossible to monitor every user journey, across every device and browser, 24/7. This is where the true value of an automated solution becomes crystal clear, providing the constant vigilance that manual checks just can't match.
The Hidden Dangers of Security and Privacy Errors
Beyond the typical glitches that break a user’s experience, a more sinister class of web page errors operates in the shadows. These issues don't just cause frustration; they open the door to serious security vulnerabilities and privacy liabilities that can expose sensitive data and do lasting damage to your brand.
Think of these errors not as broken links, but as a faulty lock on your digital front door. A user might not even notice it’s broken, but it leaves your entire operation exposed to some pretty significant risks.
HTTPS and Certificate Errors
One of the most critical security flaws involves HTTPS and SSL/TLS certificates. This is the basic tech that encrypts the connection between a user's browser and your server, keeping things like passwords and credit card numbers private. When this system fails, modern browsers throw up aggressive, full-page warnings like "Your connection is not private."
That warning stops most users dead in their tracks, causing a massive drop-off in traffic and conversions. The scale of this is huge—in a single month, monitoring services have caught over two million certificate errors. For businesses that rely on analytics, this means tracking pixels never even fire, creating enormous data gaps and attribution failures.
These security warnings do more than just block traffic; they actively erode user trust. A visitor who sees a security alert is unlikely to return, associating your brand with risk and unprofessionalism.
Consent Management Failures
In the age of GDPR and CCPA, how you handle user consent isn't just good practice—it's a legal requirement. A consent management platform (CMP) is supposed to stop tracking scripts from firing until a user explicitly opts in. When it fails, you’ve got a high-stakes web page error on your hands.
If a CMP misfires or is misconfigured, marketing and analytics pixels can load before the user gives consent. This is a direct violation of privacy regulations and can lead to some eye-watering fines. It’s a silent error your team might never see without specialized monitoring, yet it carries enormous legal risk. You can learn more about privacy and compliance in our article to get a better handle on this.
The Leaky Data Pipe of PII
Perhaps the most dangerous privacy error of all is the unintentional leaking of Personally Identifiable Information (PII). This is what happens when sensitive user data—like names, email addresses, or phone numbers—is mistakenly captured in analytics events or sent to third-party marketing tools.
Imagine your analytics data stream as a water pipe. A PII leak is like a crack in that pipe, silently dripping sensitive information to places it should never, ever go. This could be triggered by a simple configuration mistake or a poorly defined analytics event. The consequences are severe, ranging from violating your terms of service with analytics vendors to facing legal action and losing customer trust for good. Learning how to make a website secure is a crucial first step in preventing these kinds of data leaks.
Moving from Manual Checks to Automated Observability
Trying to find web page errors manually is like being a night watchman patrolling a massive warehouse with just a flashlight. You can check one aisle at a time, and you might spot an obvious problem right in front of you. But you’re guaranteed to miss the subtle issues happening two aisles over or the silent threats that pop up the moment you turn your back.
This spot-checking approach is fundamentally flawed. It's tedious, repetitive, and only gives you a tiny snapshot of a single user journey on one device at one specific moment. It’s a purely reactive process that leaves your analytics wide open to countless errors slipping through the cracks.

That’s why modern, data-driven teams are ditching the flashlight for a much smarter, more scalable solution: automated observability.
What Is Automated Observability
Automated observability is the modern answer to manual debugging. Instead of a human with a flashlight, it’s like installing a network of thousands of smart sensors that monitor every corner of your warehouse, 24/7. These systems don't just look for problems; they understand what "normal" looks like and instantly flag anything that deviates.
In the world of web analytics, platforms like Trackingplan act as this automated sensor grid for your entire digital presence. They work quietly in the background to:
- Automatically discover every single analytics tag and marketing pixel on your websites and apps.
- Monitor every event and user interaction as it happens, in real time.
- Validate all incoming data against your master tracking plan to guarantee accuracy and consistency.
This strategic shift turns error detection from a reactive, manual chore into a proactive, automated discipline.
The core idea behind observability is moving from asking "Is our website broken?" to having a system that automatically tells you, "This specific user action for this campaign is sending incorrect data," the moment it happens.
From Spot-Checking to Continuous Monitoring
An automated platform doesn’t just do the same manual checks faster; it operates on a completely different level. It sees the entire picture—every user session, on every device, across every region—all at once. This lets it catch issues that are practically impossible to find by hand.
For example, a manual check would likely miss an error that only affects users on a specific Android version using a Firefox browser in Germany. An observability platform catches it immediately because it monitors 100% of the traffic, not just a tiny sample. You can learn more about the principles of data observability and how it provides this kind of comprehensive coverage.
This constant vigilance provides game-changing capabilities for any team that depends on accurate data.
The Power of Real-Time Alerts and Proactive Fixes
The real value of an automated system is its ability to alert you to problems before they corrupt your dashboards or impact the business. Instead of finding a data issue weeks later during a quarterly report, your team gets an instant notification with all the context needed to fix it.
Here are just a few of the critical web page errors that automated observability can detect in real time:
- Broken or Missing Events: Get an alert the moment a "purchase" or "lead_generated" event stops firing after a new code release.
- PII Leaks: The system can flag when sensitive user information, like an email address, is accidentally sent to an analytics platform, preventing serious privacy breaches.
- Inconsistent Campaign Tagging: Automatically detect when UTM parameters don't follow your company's conventions, ensuring clean and reliable campaign attribution.
- Schema Mismatches: Instantly identify when a developer changes an event property (e.g., from
pricetoitem_price), which would otherwise break reports.
By moving from manual checks to automated observability, you graduate from being a reactive data janitor to a proactive data guardian. This ensures your teams can trust the data they use to make decisions, protecting your analytics investment and fixing issues long before they ever become a business problem.
A Proactive Framework for Preventing Errors
The best way to deal with web page errors isn't to get better at debugging them—it's to stop them from happening in the first place. When you adopt a proactive framework, you shift your organization from a state of constant firefighting to one of intentional quality control. This approach builds a culture around data reliability and, in turn, protects your entire analytics investment.
Instead of waiting for a broken dashboard to tell you something’s wrong, you can implement a series of best practices that catch errors long before they ever reach production. It’s about making quality assurance a core part of your workflow, not just a final check. The end goal is to create a system where you can trust your data by default.
Build Your Data Quality Checklist
A resilient analytics setup starts with clear rules and processes that everyone on your team understands and follows. This strong foundation is your first line of defense against human error, ensuring consistency across all your projects and campaigns.
Here are a few foundational practices to put in place today:
- Establish a Single Source of Truth: Your entire tracking plan needs to live in one central, accessible place. This document becomes the playbook for developers, marketers, and analysts, eliminating any confusion about which events and properties to track.
- Create Clear Data Governance: Define and enforce strict naming conventions for everything. This means event names, properties, and especially the UTM parameters your marketing team uses. Consistency here is the key to clean, reliable attribution.
- Integrate QA into Development: Make analytics testing a non-negotiable part of every development sprint. Before a new feature goes live, it needs to be verified for both functionality and correct data tracking.
Automate and Audit Continuously
With a solid foundation in place, the next step is to layer on automation to maintain quality as you scale. Manual checks are great, but they simply can’t offer the constant vigilance needed to catch every single potential issue.
A proactive strategy combines strong governance with automated oversight. This dual approach ensures that your data is not only correctly implemented from the start but also continuously monitored for any deviations or unexpected failures.
For ongoing protection, you should:
- Set Up Automated Monitoring: Use an observability platform to watch your analytics implementation 24/7. This system should fire off immediate alerts through Slack or email the moment it detects an anomaly, a broken event, or even a PII leak.
- Perform Regular Tag Audits: Every so often, take a good look at all the marketing and analytics tags running on your site. This is how you find and get rid of outdated or "rogue" pixels that might be slowing down your site or creating data conflicts.
This proactive framework turns data quality into a shared responsibility, empowering your teams to make decisions with confidence.
A Few Common Questions About Web Page Errors
Diving into web page errors usually brings up some recurring questions. Let's tackle a few of the most common ones to firm up the core ideas you need to keep your data clean and reliable.
What Is the Difference Between a 404 and a 500 Error?
It all comes down to where the problem happened.
A 404 'Not Found' error is a client-side issue. This means your browser successfully reached the website's server, but the server just couldn't find the specific file or page you asked for. A good analogy is asking a librarian for a book that simply isn’t in the library's collection—the system works, but the item is missing.
On the other hand, a 500 'Internal Server Error' is a server-side breakdown. The server got your request but then something went wrong on its end, preventing it from sending anything back. Think of this as the library's entire catalog system crashing. The book might be right there on the shelf, but the system is so broken it can't find anything at all.
Why Does My Web Page Look Fine but Still Have Tracking Errors?
This is easily one of the most common—and most dangerous—web page errors out there. A website can look and feel perfect to a visitor, with all the visuals loading flawlessly, while the analytics and marketing scripts running in the background are completely broken.
This usually happens because of subtle code conflicts, a bad tag manager setup, or a flawed implementation that nobody caught. The user has a great experience, none the wiser, but your business is left flying blind. You collect zero data on their behavior, how they interacted with a campaign, or if they converted.
This exact problem is why automated observability is so essential. It’s like an invisible quality assurance layer that spots the data-layer errors human eyes will always miss, protecting your analytics from being silently corrupted.
Are Browser Developer Tools Enough to Find All Errors?
Browser dev tools are fantastic for what they do—real-time debugging on a single page, in a single session. But they are far from a complete monitoring solution. Their scope is, by design, limited to what you can see and do right then and there.
They can't watch your entire site 24/7. They can't catch issues that only pop up for users in a different country, on a specific browser, or using a certain device. You'd never see an intermittent server hiccup or a bug that only happens deep inside a user journey you aren't personally testing at that exact moment.
For continuous, sitewide monitoring that flags every issue the second it happens, you really need an automated platform. It provides the kind of comprehensive coverage that manual spot-checks just can't hope to match.
Ready to stop web page errors from silently corrupting your analytics? Trackingplan offers a fully automated observability platform that discovers, monitors, and validates your entire analytics setup in real time. Get instant alerts on broken events, PII leaks, and tagging errors before they impact your business decisions. Start ensuring your data integrity today.