
TL;DR:
- Real-time anomaly detection continuously identifies data deviations instantly as they occur, enabling prompt responses. It plays a critical role in preventing system failures, security breaches, and data inaccuracies by detecting various anomaly types like point, contextual, and collective anomalies. Implemented through layered architecture and algorithms such as Random Cut Forest and EWMA, it faces challenges like data quality, concept drift, and balancing false positives.
Real-time anomaly detection is the practice of identifying unusual patterns, outliers, or deviations in data streams the moment they occur, before they escalate into system failures, security breaches, or corrupted analytics. Most teams discover problems after a report flags them the next morning. Real-time anomaly detection replaces that delay with an always-on monitoring system that catches deviations as data flows in. For data analysts and tech professionals managing high-stakes pipelines, this distinction matters enormously. This article breaks down how it works, which techniques hold up in production, and where the real implementation challenges hide.
Table of Contents
- Key takeaways
- What is real-time anomaly detection and why it matters
- How real-time anomaly detection works: architecture and algorithms
- Implementation challenges and best practices
- Real-world applications of real-time anomaly detection
- My take on where real-time anomaly detection is heading
- How Trackingplan detects anomalies in your analytics stack
- FAQ
Key takeaways
| Point | Details |
|---|---|
| Anomaly types determine approach | Point, contextual, and collective anomalies each require different detection strategies and algorithms. |
| Speed is measured in milliseconds | Production fraud detection systems evaluate transactions within sub-300ms latency, setting the bar for all real-time systems. |
| Concept drift breaks static models | Baselines must adapt continuously, but adaptation speed itself requires careful tuning to avoid masking real anomalies. |
| LLMs are changing root cause analysis | AI-powered systems can now connect logs, metrics, and code changes to explain anomalies in plain language. |
| Data quality is the foundation | Accurate anomaly detection is impossible without clean, well-structured incoming data from reliable tracking sources. |
What is real-time anomaly detection and why it matters
Real-time anomaly detection is the automated process of continuously analyzing data streams to flag observations that deviate significantly from expected behavior, with detection happening during ingestion rather than after storage. The “real-time” part is not marketing language. It describes a technical constraint: the system must score each event while the stream is live, with latency low enough to trigger a response before the damage spreads.
The misconception worth correcting upfront is that anomaly detection is just about finding errors after they happen. That describes batch anomaly detection, which processes stored data on a schedule. Real-time detection is proactive. Think of it as the difference between a smoke alarm and a fire inspector who visits quarterly. One stops the fire, the other documents what burned.
Why does this matter for your work specifically? Because the cost of delayed detection compounds quickly. A misconfigured tracking pixel goes undetected for 48 hours, and you lose two days of attribution data. A fraud pattern undetected for 60 seconds can process thousands of transactions. Real-time anomaly detection closes that window.
What are anomalies in real-time data
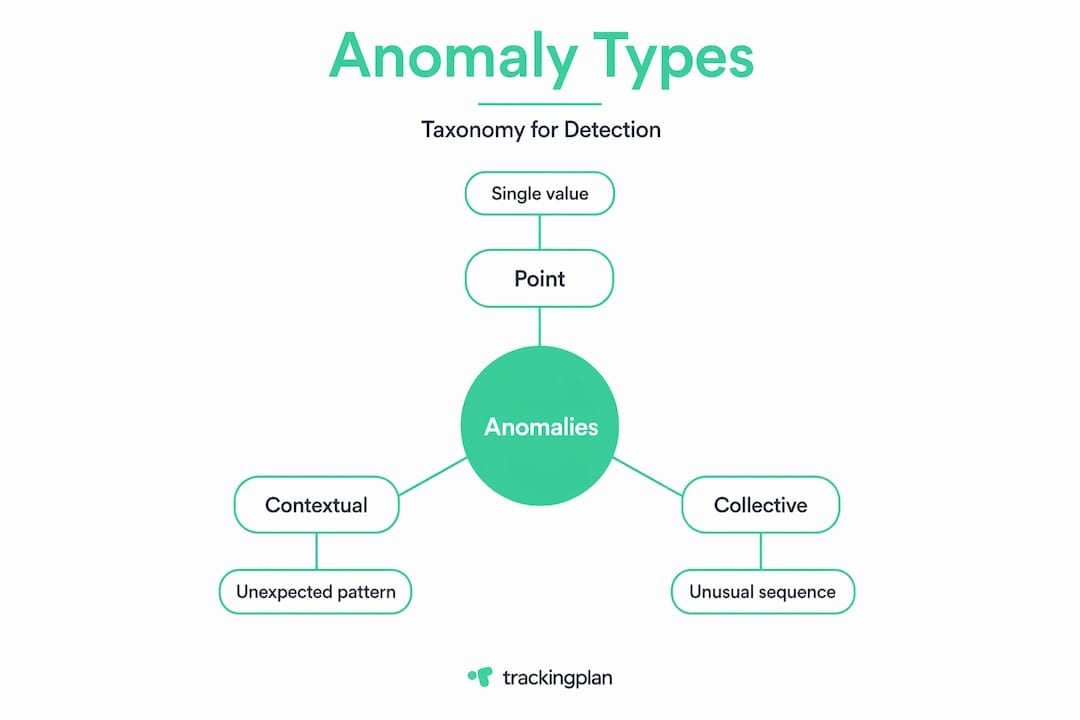
Not all anomalies look the same, and misidentifying the type leads to picking the wrong detection approach. There are three core categories every analyst should know.
Point anomalies are single data points that fall far outside the normal range. A server response time spiking from 200ms to 8,000ms is a classic example. These are the easiest to detect and the most commonly discussed.

Contextual anomalies are values that look normal in isolation but are suspicious given their context. A traffic spike at 3 a.m. on a Tuesday is contextually abnormal even if the raw number would be unremarkable during peak hours. This type requires the system to understand seasonality, time of day, and user behavior patterns before making a judgment.
Collective anomalies are sequences or groups of data points that are each individually normal but collectively indicate a problem. A series of login attempts from different geographic locations, each one ordinary on its own, collectively signals a credential-stuffing attack.
Understanding this taxonomy matters because it shapes everything downstream: which algorithm you choose, what your baseline looks like, and how you tune thresholds. Streaming data adds additional complications. Volume is high, velocity is constant, and variability is inherent. Three terms you will encounter throughout any serious implementation are baseline (the expected behavior model), concept drift (when the underlying data distribution changes over time, making your baseline stale), and latency (the time between an event occurring and your system flagging it).
How real-time anomaly detection works: architecture and algorithms
Understanding real-time anomaly detection explained at a surface level is straightforward. Understanding how it actually runs in production is where most articles stop short. Let us go deeper.
A production real-time anomaly detection system has four layers: data ingestion, feature computation, model scoring, and alerting. Each layer has latency requirements and failure modes that affect the others.
Streaming platforms and event processing
Apache Kafka handles data ingestion at scale, acting as the distributed message queue that buffers incoming events. Apache Flink then processes those events in true streaming mode, applying windowed computations and model inference with sub-second latency. One critical distinction that many implementations get wrong is event time vs. processing time. Event time is when the event actually occurred on the source system. Processing time is when your pipeline received it. Out-of-order or delayed events, such as mobile app events sent after a user reconnects to the internet, can skew anomaly scores if your system treats processing time as ground truth. Watermarking strategies in Flink allow you to define how long the system waits for late-arriving data before closing a window and computing results.
Algorithm comparison
Different algorithms suit different anomaly types and latency budgets. The table below summarizes the most commonly deployed options.
| Algorithm | Best for | Latency profile | Key limitation |
|---|---|---|---|
| Z-score / EWMA | Point anomalies, simple baselines | Very low | Struggles with seasonal data |
| ARIMA | Time-series with trend/seasonality | Moderate | Computationally expensive at scale |
| Random Cut Forest | High-dimensional, unsupervised | Low | Requires tuning tree count and sample size |
| Isolation Forest | Batch-friendly outlier detection | Moderate | Less suited to pure streaming |
| LSTM / Neural nets | Complex sequential patterns | High | Needs retraining infrastructure |
Random Cut Forest deserves specific attention because it is purpose-built for streaming. Configured with 100 trees and sample size 256, it can detect spikes in log streams exceeding 230,000 events per minute. Setting the anomaly threshold at the 98th percentile balances sensitivity against alert noise in most production environments. Exponentially Weighted Moving Average (EWMA) is simpler and faster, making it a strong default for single-metric monitoring where speed matters more than nuance.
For teams that need high throughput across many signals simultaneously, hybrid statistical-machine learning frameworks have demonstrated processing throughput of 127,000 records per second at 7.8ms average latency, with F1-scores reaching 94.3%. That combination of speed and accuracy is what makes them the architecture of choice at scale.
Pro Tip: Start with EWMA or z-score methods for your first production deployment. They are interpretable, fast to tune, and give your team a clear baseline to compare against when you eventually graduate to more complex models.
Implementation challenges and best practices
Knowing the algorithms is the easy part. Getting a real-time anomaly detection system to behave reliably in production is where most teams run into trouble. Here are the challenges that matter most, along with how to approach them.
Balancing false positives and false negatives is the central tension of every anomaly detection system. Too many false positives and your team starts ignoring alerts. Too few, and real problems slip through. The right balance depends on the cost asymmetry of your domain. In fraud detection, a missed anomaly costs far more than a false alarm. In marketing analytics, the opposite might be true. Set your thresholds based on that cost structure, not just on what produces the cleanest-looking precision-recall curve in testing.
Concept drift is the silent killer of static anomaly detection models. Your baseline captures what “normal” looks like today. But user behavior shifts, products change, traffic patterns evolve, and your model gradually becomes misaligned with reality. Sliding window and EWMA methods help baselines adapt continuously, and segmentation by time of day or day of week handles seasonal variation. But here is the nuance most teams miss: adaptation speed is itself a tuning parameter. Adapt too fast and your model absorbs a real anomaly into the baseline, making future instances look normal. Adapt too slow and rising false positive rates erode trust in the system.
Noisy data and out-of-order events compound every other challenge. Sensors drop packets, mobile clients batch events, and network delays mean events arrive minutes after they occurred. Without explicit handling for late data, your anomaly scores reflect pipeline artifacts rather than actual system behavior.
- Implement watermarking in your stream processor to define acceptable lateness windows.
- Separate the “detection” layer from the “alerting” layer so that brief data gaps do not trigger spurious alerts.
- Validate incoming data schema before it reaches the detection model, since a malformed event can skew rolling statistics significantly.
- Use multi-source context when possible. A single metric spike is ambiguous; the same spike correlated with an error rate increase and a recent deployment is actionable.
Pro Tip: Build root cause context into your alerts from the start. An alert that says “traffic dropped 40%” is frustrating. An alert that says “traffic dropped 40%, co-occurring with a JavaScript error spike on the checkout page” is something your team can act on in minutes.
Reducing detection latency requires architectural decisions, not just algorithmic ones. Keep feature computation close to ingestion. Pre-compute rolling statistics rather than recalculating from scratch for each event. And invest in tracking issue detection at the data source itself, because a detection system is only as reliable as the data feeding it.
Real-world applications of real-time anomaly detection
The applications of anomaly detection span almost every industry, but a few domains have pushed the technology furthest because the cost of missed detections is highest.
-
Cybersecurity. Network intrusion detection systems analyze packet-level traffic in real time, flagging behavioral patterns consistent with zero-day exploits, lateral movement, or data exfiltration. The advantage of real-time detection here is not just speed. It is the ability to catch attacks that leave no signature in traditional rule-based systems, because the anomaly is a deviation from learned normal behavior rather than a match against a known threat pattern.
-
Financial fraud detection. Modern fraud pipelines evaluate transactions in under 300ms, incorporating signals like transaction velocity, geographic anomalies, and account history. At that latency, the system can block a fraudulent card transaction before it clears, rather than flagging it for review the next day. Kafka-based architectures connected to feature stores make this possible by pre-computing user-level features continuously rather than at query time.
-
Predictive maintenance in industrial operations. Vibration sensors, temperature readings, and pressure gauges on manufacturing equipment generate continuous streams. Anomaly detection models trained on historical failure data identify the signature patterns that precede equipment failure, often hours or days in advance. Catching these early translates directly to avoided downtime costs that can run into the hundreds of thousands of dollars per incident.
-
Marketing analytics and data quality monitoring. This is the application closest to many readers of this article. Anomaly detection in marketing campaigns catches problems like tracking pixel failures, conversion rate drops after a site update, or sudden traffic pattern shifts that indicate a broken campaign. Analytics teams that rely on daily batch reports discover these issues 24 hours too late. Real-time detection flags them within minutes, which is the difference between losing a day of data and losing a week. For context, better analytics data connects directly to stronger campaign ROI, making data quality monitoring a business-critical function, not just a technical hygiene task.
-
Email deliverability monitoring. Minute-level anomaly detection in email platforms can identify bounce spikes and ISP blocks rapidly, triggering protective actions within 30 to 60 seconds of a signal deviation. In high-volume sending environments, a 90-second delay in detecting a reputation issue can cascade into days of inbox-placement problems.
The emerging trend worth tracking is LLM-powered root cause analysis, which connects anomaly detection outputs to multi-source context including logs, metrics, and recent code changes, generating human-readable explanations. This closes the gap between “we detected something” and “here is what caused it and what to do next.”
My take on where real-time anomaly detection is heading
I have watched teams implement anomaly detection systems across a wide range of industries, and the pattern I see most often is this: the technology choice is not the hard part. The organizational shift is.
Moving from reactive reporting to proactive prevention requires teams to trust automated systems enough to act on their alerts without manual verification every time. That trust takes months to build, and it gets built by starting narrow. Pick one high-value metric, get the detection working reliably for that metric, and let the track record accumulate before expanding scope.
What I find genuinely exciting right now is how LLM-powered root cause analysis is changing the conversation. Traditional anomaly detection scores tell you that something is wrong. They rarely tell you why. Systems that connect multi-source contextual data including metrics, logs, traces, and code diffs are starting to produce explanations that junior analysts can act on without escalating to senior engineers. That is a real capability shift, not just incremental improvement.
The thing practitioners consistently underestimate is data quality at the source. I have seen teams spend months tuning sophisticated models only to discover their detection accuracy was limited by dirty input data. Schema mismatches, missing fields, and broken tracking implementations create noise that looks like anomalies and masks real ones. Getting your data pipeline clean is not glamorous work, but it is the prerequisite that determines whether your anomaly detection investment pays off.
My advice for teams starting this work today: treat your baseline as a living artifact, not a one-time configuration. Build in scheduled reviews of your thresholds, and monitor the rate of alerts your team actually acts on. That action rate is your real precision metric.
— David
How Trackingplan detects anomalies in your analytics stack

If you are responsible for digital analytics data quality, Trackingplan gives you real-time anomaly detection purpose-built for marketing and analytics implementations. The platform continuously monitors your tracking across websites, apps, and server-side environments, flagging schema mismatches, broken pixels, traffic spikes and drops, and campaign misconfigurations the moment they occur. Alerts arrive via Slack, email, or Teams, so your team knows immediately rather than discovering problems in the next morning’s report.
Trackingplan’s digital analytics data quality tools integrate directly with your existing analytics stack, providing automated audits and root-cause context alongside every alert. For teams that also need to stay on the right side of privacy regulations, the Privacy Hub adds compliance monitoring directly into the same real-time detection workflow. For data analysts who need clean, reliable data to make decisions, Trackingplan removes the manual effort of tracking verification and replaces it with continuous, automated confidence.
FAQ
What is real-time anomaly detection?
Real-time anomaly detection is the automated process of identifying unusual patterns in data streams during ingestion, with detection latency low enough to enable an immediate response before the anomaly causes downstream damage.
How does real-time anomaly detection work?
Data flows through an ingestion layer such as Apache Kafka, is processed by a streaming engine like Apache Flink, scored by a model such as Random Cut Forest or EWMA, and routed to an alerting system when a score exceeds a defined threshold. The entire pipeline operates continuously rather than on a batch schedule.
What are the main types of anomalies in real-time data?
The three core types are point anomalies (a single outlier value), contextual anomalies (a value that is unusual given its surrounding context, such as time of day), and collective anomalies (a sequence of events that are each individually normal but together indicate a problem).
What are the benefits of real-time anomaly detection?
The primary benefit is replacing delayed, report-based incident discovery with proactive alerts that surface problems in seconds or minutes. This directly reduces the cost and impact of issues like fraud, system failures, tracking errors, and data quality degradation.
Which algorithm is best for streaming anomaly detection?
Random Cut Forest is widely used for high-volume streaming because it handles unsupervised, high-dimensional data at low latency. For simpler, single-metric monitoring, EWMA provides fast and interpretable detection without the overhead of tree-based methods.