
Synthetic monitoring is a proactive testing method where automated scripts simulate user journeys and run 24/7, often every 1–5 minutes for revenue-critical flows like checkout or login. It helps teams catch outages, regressions, and regional issues before real customers report them.
If you're responsible for a website, app, checkout, lead form, or campaign landing page, you already know the uncomfortable version of this story. The page still loads. The ads are still spending. The dashboard looks mostly normal. Then someone notices that registration has been broken for hours, or the payment step fails only in one region, or the confirmation page works but the analytics event never fires.
That first problem is where synthetic monitoring shines. It gives teams a controlled way to test important flows continuously instead of waiting for live traffic to reveal failures. For digital analysts and marketers, that outside-in visibility is useful, but it doesn't answer everything. A synthetic check can tell you that a button worked. It usually can't tell you whether the marketing and analytics stack attached to that interaction worked correctly too.
Why Proactive Monitoring Matters
Most production failures aren't dramatic. They don't always take the whole site down. More often, one important path breaks unnoticed: login stops submitting, checkout hangs on a later step, a lead form appears fine but never completes. If nobody is actively testing those paths, the first alert often comes from a customer, a sales rep, or a drop in conversions.
Synthetic monitoring exists to prevent that silence. It uses scripted transactions to simulate user actions from different locations, devices, and scenarios, then records whether the application responds and how long each step takes. Unlike passive measurement, it doesn't wait for real traffic to show up.
That change in operating model matters more than the tooling label. You're moving from "tell me when users complain" to "probe the system continuously and compare against a baseline."
From uptime checks to experience checks
Synthetic monitoring started as a simpler practice. Teams used it to answer a basic question: is the service up? Over time, it evolved into a broader discipline for digital experience and SLA validation across global locations, scenarios, and devices, as described in Fortune Business Insights' overview of synthetic monitoring.
Today, the useful question isn't just whether a homepage returns a response. It's whether a business journey works from the places your users come from, under repeatable conditions, with enough consistency to support incident response and operational review.
Why this matters to analysts and marketers
For infrastructure teams, proactive checks reduce blind spots. For analysts and growth teams, they create context. If conversion drops, you need to know whether the problem is demand, UX, app performance, or a broken transaction path.
A practical monitoring stack should answer both "is the journey working?" and "is the signal trustworthy?" That's why teams often pair experience monitoring with analytics-focused controls such as real-time monitoring for ROI and operational visibility.
Practical rule: Monitor the journeys that make money or collect leads first. If a path affects revenue, signups, or reporting confidence, it deserves proactive coverage.
How Synthetic Monitoring Works
A good mental model is simple: you deploy robot users to perform the same actions over and over, from different places, on a schedule. They don't improvise. That's the point. Because the path is controlled, the output is comparable across runs.
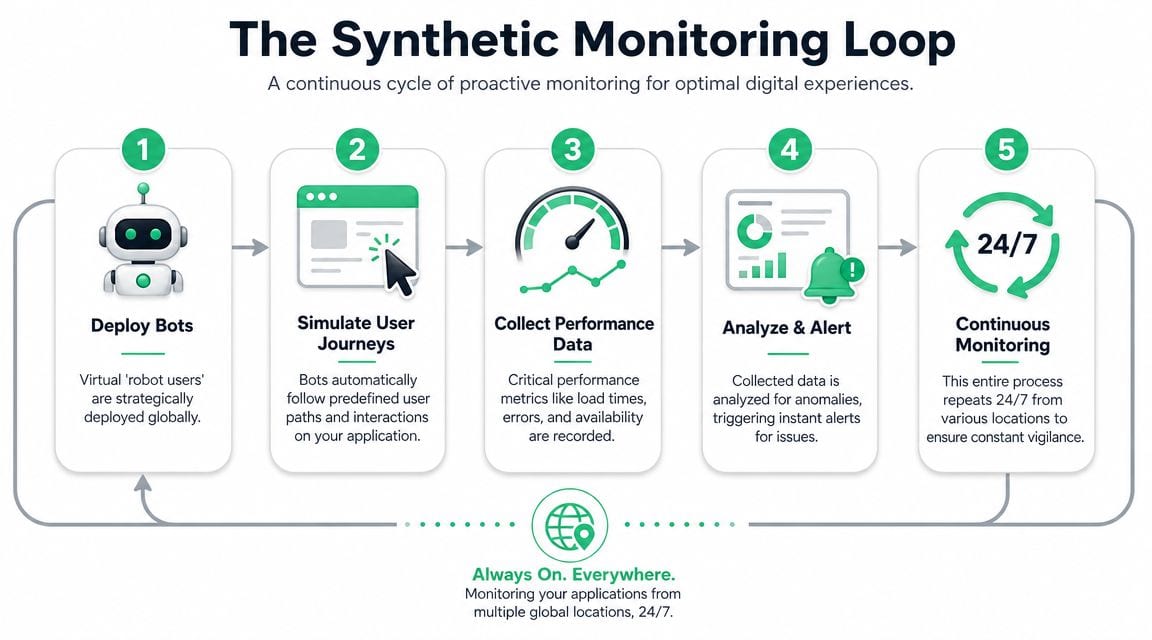
Step one defines the journey
Every synthetic check starts with a script. Sometimes that's a basic request to an endpoint. Sometimes it's a browser flow that loads a page, clicks through navigation, fills a form, signs in, adds a product to cart, or reaches a confirmation page.
The important part is choosing a path that matters operationally. Monitoring a blog page is fine. Monitoring a login, checkout, booking flow, or lead form is usually more valuable.
In practice, teams often map checks to business risk:
- Critical revenue paths: Checkout, login, account access, and payment APIs usually get the tightest schedules.
- Secondary paths: Content pages, support pages, or less sensitive endpoints often run less frequently.
- Supporting services: DNS and SSL checks sit in their own category because they can break access even when the application code is fine.
Step two chooses where to run it
A single successful check from one region doesn't prove the experience is healthy everywhere. Synthetic monitoring became much more useful once teams began testing from global locations, because it exposed regional latency, edge routing problems, and location-specific failures.
That global coverage is one reason synthetic monitoring is used for proactive issue detection, regional benchmarking, and objective SLA records, not just basic uptime. If your users are distributed, your checks should be too.
A passing result from one vantage point proves only that the scripted path worked there. It doesn't prove the same path works for every geography, ISP, device, or audience segment.
Step three sets the schedule
Synthetic monitoring is an active method, so cadence is part of the design, not an afterthought. Industry guidance described in Dotcom-Monitor's explanation of synthetic monitoring notes that revenue-critical flows such as checkout, login, or payment APIs are commonly tested every 1–5 minutes, while secondary endpoints may be checked every 10–15 minutes and DNS or SSL checks every 30–60 minutes.
That schedule is what gives you coverage during low-traffic periods, maintenance windows, and after business hours. The service is still being tested even when no users are present.
A useful companion workflow is to keep application observability and analytics validation close together. If you're building a process for reliable instrumentation, this guide to step-by-step analytics monitoring for accurate tracking fits naturally beside synthetic checks.
A short walkthrough helps if you want to see the concept in action:
Key Metrics and Common Failure Modes
A synthetic test is only useful if the output tells you what broke and why it matters. I usually group the results into three buckets: availability, performance, and transaction success. That keeps teams from getting stuck in raw timing data without a business interpretation.
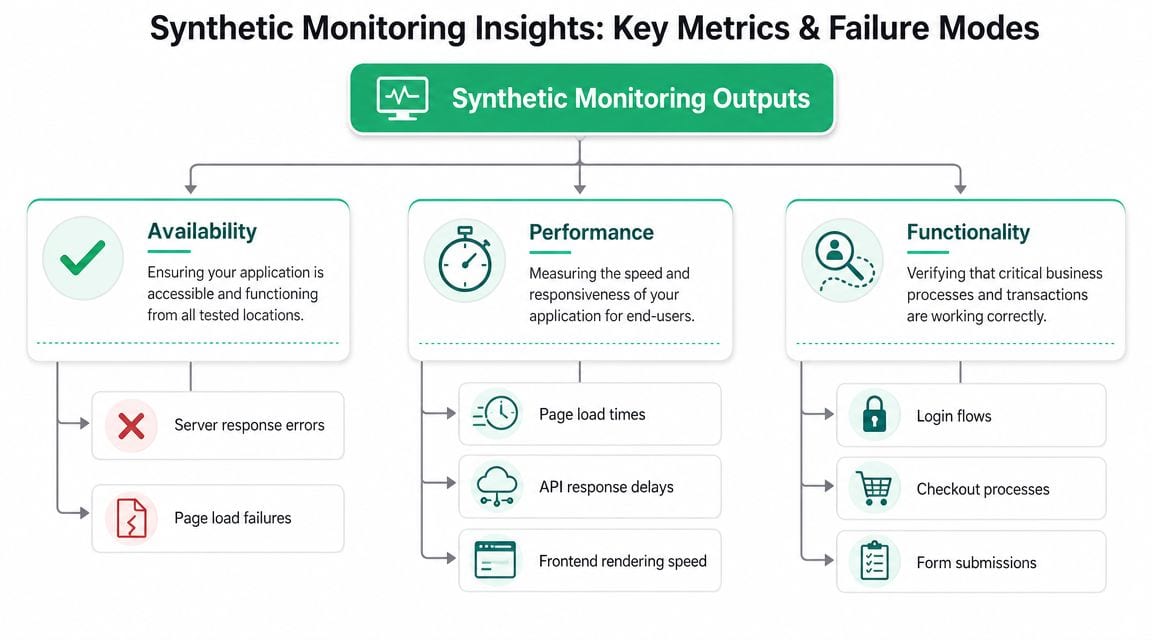
Availability tells you if the service is reachable
Availability is the first gate. If the page doesn't load or the endpoint doesn't respond, deeper diagnostics can wait.
Teams usually watch for signs like:
- Endpoint failure: The request doesn't complete, times out, or returns an obvious error condition.
- Page load failure: The browser opens the page, but critical content never renders or the journey can't proceed.
- Support-layer issues: DNS resolution problems or SSL failures block access before the application itself gets a fair chance to respond.
Availability checks are blunt, but they catch some of the most damaging incidents quickly.
Performance shows whether the path is degrading
A journey can be technically available and still be unusable. That's where response-time and step-timing measurements matter. On a browser flow, the test can show whether the page is loading slowly, whether a specific API-backed step is lagging, or whether a redirect or script introduces a noticeable delay.
You don't need a huge metric catalog to get value. A small set of repeatable timings is enough to answer practical questions:
| Metric area | What you learn | Typical failure pattern |
|---|---|---|
| Availability | Can the service be reached at all | Page or endpoint doesn't complete |
| Response time | Is the service slower than its normal baseline | Gradual slowdown or sudden latency spike |
| Step timing | Which action in the journey got worse | Login, add-to-cart, or submit step stalls |
| Transaction success | Did the full path complete | Multi-step flow fails before confirmation |
For analytics-focused teams, operational monitoring starts to overlap with reporting confidence. If a checkout submit step is slow, conversion may drop. If it fails outright, campaign attribution and funnel analysis become suspect too. That's one reason a reliable GA4 monitoring and anomaly detection workflow belongs near your app monitoring practice.
Transaction success answers the business question
The most useful synthetic tests don't stop at page load. They verify whether a real business task completes. Can a user log in? Can they add to cart? Can they submit the form? Can they finish payment?
Those checks often catch failures that broad uptime monitoring misses:
- Broken JavaScript interactions: The page loads, but the button does nothing.
- API-dependent steps: A backend endpoint responds slowly or fails during a later stage of the flow.
- Third-party interruptions: A dependency such as a payment component or embedded service prevents completion.
- Certificate or routing issues: Access breaks before the user can even begin the journey.
If your monitoring stops at "homepage loads," you're not monitoring the business. You're monitoring a door.
Synthetic Monitoring vs Real User Monitoring RUM
The simplest way to explain the difference is this: synthetic monitoring is the lab, and RUM is the wild. One is controlled and proactive. The other captures what actual users experience.
That distinction matters because teams often expect synthetic checks to answer questions they were never designed to answer.
Side-by-side comparison
| Criterion | Synthetic Monitoring | Real User Monitoring (RUM) |
|---|---|---|
| Data source | Scripted, non-user traffic generated by automated tests | Real traffic from actual visitors and customers |
| Collection model | Active and scheduled | Passive during live usage |
| Best use | Proactive checks on known critical paths | Understanding actual audience experience |
| Works with no traffic | Yes | No |
| Before launch | Yes | No practical signal until users arrive |
| Geographic testing | Intentional and controlled by selected test locations | Based on where real users actually come from |
| Coverage style | Only the journeys you script | Whatever users actually do |
| Main blind spot | Doesn't represent true user diversity | Doesn't help much when no one is using the product |
What synthetic monitoring cannot prove
This is the most important nuance in the whole topic. Synthetic monitoring uses scripted, non-user traffic, so it does not measure real-user experience, real audience diversity, or traffic-dependent failures, as explained in Elastic's overview of synthetic monitoring limits.
That means a clean synthetic run doesn't automatically prove that users are fine. It proves that the scripted path succeeded under the conditions you chose.
Here's where teams get tripped up:
- A synthetic script may pass while real users on slower devices struggle.
- A controlled journey may succeed while an unscripted path breaks.
- A low-volume synthetic probe won't reveal failures that appear only under real traffic patterns.
- A scripted browser action may complete while user frustration still rises because the UI is confusing or unstable in ways the script doesn't detect.
Why the two belong together
Synthetic monitoring is excellent for catching known failure modes early. RUM is excellent for telling you what people experienced. If you use only synthetic checks, you risk mistaking a clean lab result for a healthy customer experience. If you use only RUM, you won't see much until users have already encountered the issue.
Synthetic tells you whether the planned path works. RUM tells you whether real people had a good time on the unplanned ones.
For digital teams, the pairing is straightforward. Use synthetic checks to watch core business journeys before users report problems. Use RUM to validate whether those issues are widespread, regional, device-specific, or concentrated in a particular audience.
Common Use Cases and Implementation Methods
Different teams adopt synthetic monitoring for different reasons, but the pattern is usually the same. They have a business risk they don't want to discover too late.
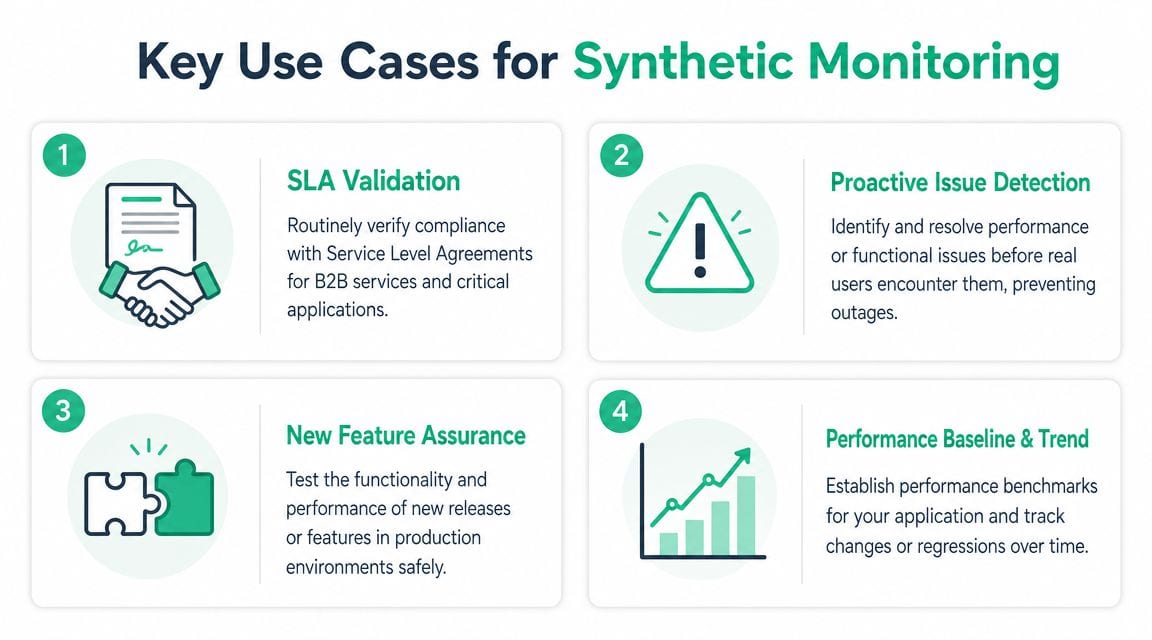
Three common scenarios
A B2B platform team may need objective records for SLA conversations. In that case, synthetic checks serve as a timestamped outside-in record of availability and transaction health from selected regions.
A product engineering team may use synthetic tests as a release safety net. Before or after deployment, they run a small set of checks against the journeys most likely to break. This doesn't replace QA. It creates an operational tripwire around production risk.
A growth team may care about campaign landing pages, forms, and regional performance consistency. Their concern isn't just "is the site up?" It's "does the experience still support acquisition and conversion where we're actively sending traffic?"
How teams usually implement it
There isn't one correct method. The right setup depends on complexity, maintenance tolerance, and the type of journey you're monitoring.
Simple probes for basic availability
The lightest approach uses scheduled endpoint checks. This works when you only need to know whether a page, API, or service responds. It's fast to deploy and easy to maintain, but it won't tell you much about client-side behavior or multi-step flows.
Good fit:
- Status confirmation: Public pages and basic endpoints
- Operational support checks: DNS and certificate coverage
- Low-maintenance monitoring: Teams that need broad coverage with minimal scripting
Browser automation for real journeys
When you need to test logins, carts, checkouts, or forms, browser automation is the practical route. Teams commonly use tools like Playwright or Selenium for these flows because they can reproduce actual interaction sequences.
Trade-off matters here. Browser scripts are more representative, but they're also more fragile. A small UI change can break the script even when the application still works, so ownership and maintenance discipline matter.
Managed services for global execution
Many teams eventually want managed synthetic platforms because they don't want to operate runners, schedulers, and globally distributed test infrastructure themselves. The main advantage isn't convenience alone. It's consistent execution from different regions without having to build that footprint in-house.
A reasonable pattern is to start narrow:
- Choose one core business journey
- Add one or two regional vantage points
- Run checks often enough to matter operationally
- Tune alerts before expanding coverage
- Review scripts after UI or flow changes
That progression keeps the practice useful instead of turning it into a noisy side project.
Augmenting Checks with Analytics QA
This is the blind spot most synthetic monitoring guides skip. A transaction can work for the user and still fail for the data team.

A checkout button may be clickable. The order confirmation page may load. The browser script may mark the test as successful. Meanwhile, the purchase event is malformed, a consent setting blocks a destination unexpectedly, or an ad platform pixel never fires. From an infrastructure perspective, the journey passed. From a marketing and analytics perspective, the signal is broken.
Functional success is not tracking success
Traditional synthetic tools are built to answer questions like:
- Did the page load?
- Did the API respond?
- Did the scripted journey complete?
- Did a region show slower performance or a failure?
Those are important questions. They are not the same as:
- Did the expected analytics event fire?
- Were the correct properties attached?
- Did the tag go to the right destination?
- Did consent, schema, or campaign parameters break attribution quality?
That difference matters most for digital analysts, performance marketers, and agencies. They don't just need a working site. They need trustworthy measurement.
Where analytics QA fits
Analytics QA platforms observe the data layer, event schemas, destinations, consent behavior, and marketing pixels across real implementations. That makes them a complement to synthetic monitoring, not a replacement for it.
One option in that category is Trackingplan's data validation approach for digital analytics, which focuses on automated monitoring of analytics and marketing instrumentation. The practical value is straightforward: if the site "works" but the measurement breaks, the team still gets an operational signal.
A useful way to think about the split:
| Question | Synthetic monitoring | Analytics QA |
|---|---|---|
| Is the page or transaction reachable and functional? | Yes | Sometimes indirectly |
| Did the expected analytics and marketing tags fire correctly? | Usually no | Yes |
| Can it validate data layer structure and destination behavior? | Not its core job | Yes |
| Does it help protect reporting trust and attribution quality? | Indirectly | Directly |
This explainer from Trackingplan's channel is useful if you want to see how tracking issues surface in practice:
A healthy digital operation needs both layers. One verifies that the journey works. The other verifies that the business can measure what happened.
Integrating Monitoring into Your Workflow
Monitoring only helps when the signal reaches the right people in a form they can act on. The operational mistake isn't failing to buy a tool. It's letting alerts, dashboards, and ownership drift apart.
A practical setup usually has a few traits:
- Clear routing: Send app failures to engineering or SRE, and send tracking or data-quality issues to analytics owners, marketers, or implementation teams.
- Low-noise alerting: Alert on meaningful failures, not every transient wobble. Otherwise people mute the channel.
- Shared dashboards: Put service health beside conversion, funnel, and campaign KPIs so teams can correlate breakage with business impact.
- Defined review points: Revisit scripts after releases, redesigns, consent changes, and tag-manager updates.
The best workflow is the one that shortens the path from detection to diagnosis. If a synthetic test fails, someone should know what broke. If a pixel or schema breaks, someone should know whether reporting is still trustworthy. That's how monitoring becomes part of daily operations instead of a side dashboard nobody checks.
If your team already uses synthetic monitoring, add a second layer for analytics and marketing data quality. Trackingplan helps teams monitor implementations across web, app, and server-side environments so a journey that appears successful is also measured correctly.