
Your dashboard says revenue is up. Paid campaigns are producing conversions. Sales is happy. Then someone asks the question that changes the conversation: are those sales efficient?
That's where Return on Sales matters. If you're trying to learn how to calculate ROS, the arithmetic is the easy part. The hard part is making sure the inputs are clean, defined consistently, and pulled from the right systems. A ROS figure built on messy revenue data or the wrong profit line can look precise while pointing the business in the wrong direction.
For analysts and marketers, ROS is useful because it strips away vanity. It helps you connect commercial activity to operating performance. But it only works when your definition is stable and your source data is trustworthy.
What Return on Sales Really Tells You
Return on Sales, or ROS, tells you how efficiently a business turns sales into operating profit. In practice, it answers a simple management question: after the business covers the costs required to run and sell, how much operating profit is left from sales?
That makes ROS especially useful after a campaign, a pricing change, a product launch, or a shift in channel mix. Revenue alone can hide operational drag. A business can sell more and still become less efficient if fulfillment, sales, support, or other operating costs rise faster than the sales they support.
ROS is best treated as an operating efficiency metric, not a general “are we making money” shortcut. It's closer to the health of the core business engine than to headline revenue performance. That distinction matters when executives want to know whether growth is scalable or expensive.
ROS helps you separate “we sold more” from “we ran the business better.”
If you work in ecommerce or digital marketing, ROS also complements broader KPI reviews. A team can improve conversion rate, average order value, or channel revenue and still hurt efficiency if discounts expand or operating costs swell. That's why ROS belongs next to other ecommerce performance metrics, not beneath them.
When ROS is most helpful
ROS is particularly useful in a few recurring situations:
- Campaign evaluation: Revenue increased, but leadership wants to know whether operating performance improved too.
- Trend analysis: Month-over-month or quarter-over-quarter reviews need a cleaner profitability lens than top-line sales.
- Operational diagnosis: ROS can expose pressure from discounting, returns, fulfillment inefficiency, or bloated selling costs.
- Cross-functional reviews: Finance, marketing, and operations can use one common efficiency measure when definitions are aligned.
What ROS does not tell you
ROS doesn't replace net profit analysis, cash flow review, or ROI by channel. It won't tell you whether financing costs are too high or whether taxes changed the bottom line. It tells you something narrower and often more actionable: whether the business is converting sales into operating profit efficiently.
That narrowness is a strength. It keeps the conversation focused on core operations.
The ROS Formula and Its Core Components
The standard formula for how to calculate ROS is:
ROS = Operating Profit / Net Sales
That looks simple. The trouble starts when teams pull the wrong numbers into the formula.
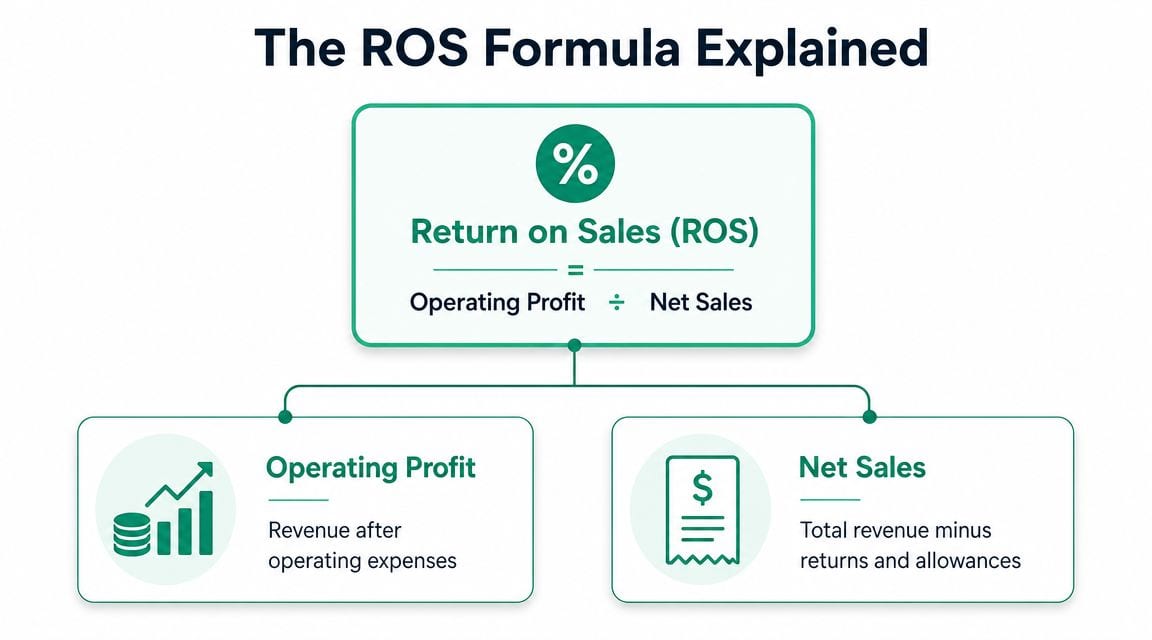
A common gap in ROS guidance is formula ambiguity. Some sources define ROS as operating profit divided by net sales, while others incorrectly use net income divided by total revenue. That difference matters because returns, discounts, and allowances belong in net sales, while interest and taxes are excluded from operating profit, so inconsistent definitions can produce materially different ROS values, as explained in Salesforce's discussion of return on sales.
Operating profit is the profit line that belongs here
For ROS, the profit input should be operating profit, often aligned with operating income or EBIT in internal reporting. The point is to isolate profit from the company's core operations.
If you use net income instead, you pull in items that ROS is not meant to measure. Interest and taxes can distort the ratio, especially when you're trying to compare periods or evaluate how efficiently operations performed.
A practical rule for analysts is simple:
- Use operating profit when the question is operational efficiency.
- Use net income for bottom-line profitability analysis, not for ROS.
- Don't swap profit definitions between reporting periods unless you clearly relabel the metric.
Net sales is not the same as top-line booked revenue
The denominator should be net sales, not a vague “revenue” field copied from the nearest dashboard. Net sales should reflect sales after returns, allowances, and discounts.
That means your ecommerce platform, ERP, and analytics layer all need to agree on what counts as a completed sale and how adjustments flow back into reporting. If one source records gross order value while another reports net recognized sales, ROS becomes inconsistent before you even open Excel.
Practical rule: If your denominator includes returns and discounts inconsistently, your ROS trend is not reliable even when the formula itself is correct.
For marketers, commercial reporting and financial reporting often drift apart. Campaign dashboards may highlight gross sales activity, while finance closes on a net basis. If your team also tracks key analytics metrics for marketing success, keep ROS in the finance-defined lane and document that definition clearly.
A simple decision table
| Component | Use for ROS | Avoid using |
|---|---|---|
| Profit input | Operating profit | Net income, gross profit |
| Sales input | Net sales | Total revenue without adjustments |
| Purpose | Core operating efficiency | Bottom-line profitability |
Most ROS mistakes aren't math mistakes. They're definition mistakes.
Finding and Validating Your Revenue and Profit Data
The most reliable starting point for ROS is your income statement, also called the profit and loss statement. That's usually where finance defines both the profit line and the sales line used in formal reporting. If you're not comfortable reading it, this guide to understanding P&L statements is a useful refresher because it clarifies where operating results sit relative to revenue and other expenses.
In day-to-day work, you'll usually find the inputs across a few systems:
- Accounting software: QuickBooks, Xero, NetSuite, Sage, or an ERP.
- Billing and commerce systems: Shopify, Stripe, Magento, WooCommerce, Salesforce.
- Analytics platforms: Google Analytics, Adobe Analytics, Amplitude, Mixpanel.
- Warehouse or BI layer: BigQuery, Snowflake, Redshift, Looker, Power BI, Tableau.
Start with finance, then trace backward
If you want a ROS number that leadership trusts, start from the finance-approved figure and trace backward into the operational sources. That means pulling the period's net sales and operating profit from the P&L, then checking whether the upstream systems support those figures.
This prevents a common analyst mistake: building ROS from raw event data first, then discovering later that finance booked returns, allowances, or expense classifications differently.
Validation checks that catch most problems
You don't need a forensic audit every month, but you do need repeatable checks. These are the ones that matter most:
- Period alignment: Confirm the accounting period matches the reporting period in analytics and billing systems.
- Adjustment handling: Check whether refunds, discounts, and allowances flow into the same period and metric definition.
- Classification review: Make sure operating expenses haven't been mixed with non-operating items in custom reports.
- Source reconciliation: Compare finance totals to transactional and analytics totals to spot missing orders or duplicate events.
A useful habit is to maintain a short metric definition sheet alongside the calculation. Write down exactly which fields feed net sales and operating profit, which system owns each field, and what exclusions apply. Junior analysts skip this because it feels bureaucratic. It isn't. It's what keeps the same metric from changing meaning every quarter.
When ROS changes sharply, check data lineage before you explain the business. The number may be telling you about a tracking issue, not an operating shift.
For digital businesses, analytics tools often capture the earliest version of sales activity. That makes them helpful for diagnosis, but not automatically authoritative for ROS. Trust comes from reconciliation, not from whichever dashboard loads fastest.
Calculating ROS in Excel and SQL
Once the definitions are settled, the calculation itself is straightforward. The primary work is structuring the data so the output is reproducible.

If you do this frequently in spreadsheets, it helps to keep source tabs separate from calculation tabs and reporting tabs. That way you can inspect the raw figures without breaking the final output. Teams that work heavily in Sheets can also improve handoff and auditability with workflows built around Google Spreadsheets for analytics operations.
Excel or Google Sheets workflow
A clean spreadsheet setup only needs a few columns:
| Period | Net Sales | Operating Profit | ROS |
|---|---|---|---|
| Reporting period | finance-approved value | finance-approved value | formula result |
In the ROS column, divide Operating Profit by Net Sales. Then format the result as a percentage if that's how your team reports margin metrics.
The practical spreadsheet process looks like this:
- Import the approved inputs from your finance or warehouse export.
- Lock the source cells or keep them on a raw-data tab.
- Add the ROS formula in a dedicated calculation column.
- Format consistently so every period uses the same display.
- Add a notes column if a period includes unusual accounting treatment, revised returns, or restatements.
Two spreadsheet habits make a big difference.
- Use named ranges or clear cell references. If someone inherits the file, they should be able to follow the formula without guessing.
- Guard against divide-by-zero cases. If net sales are blank or zero, return a blank or a controlled error message instead of a misleading result.
SQL workflow for analysts
In SQL, the main goal is to define the numerator and denominator explicitly in the query. Don't calculate ROS from whatever pre-aggregated revenue field happens to exist in a mart unless you've confirmed its definition.
A simple pattern looks like this:
SELECTreporting_period,SUM(net_sales) AS net_sales,SUM(operating_profit) AS operating_profit,CASEWHEN SUM(net_sales) = 0 THEN NULLELSE SUM(operating_profit) * 1.0 / SUM(net_sales)END AS rosFROM finance_ros_inputsGROUP BY reporting_periodORDER BY reporting_period;That example assumes you already have a curated table with the correct fields. In many companies, you'll need to build that table from several inputs:
- an orders or invoices table for sales
- a returns or credit memo table for adjustments
- an expense ledger or mapped P&L table for operating costs
What a production-ready SQL process should include
A stronger implementation usually adds business rules before the final ratio is calculated:
- Revenue normalization: subtract returns, allowances, and discounts before aggregating net sales.
- Expense mapping: include only operating expenses in the operating profit calculation.
- Time logic: use one approved accounting calendar, not mixed order dates and posting dates.
- Data tests: flag null fields, negative anomalies, and duplicated transaction keys.
Don't put ROS logic only in a dashboard formula. Put it in a documented model or SQL layer where finance and analytics can inspect it.
That's what makes the metric repeatable. Anyone can divide one column by another. Fewer teams can explain exactly why those columns deserve to be in the formula.
Common ROS Calculation Pitfalls to Avoid
Most ROS errors come from process shortcuts, not from misunderstanding the concept. Analysts often move too fast from “I know the formula” to “the metric is ready.” It usually isn't.
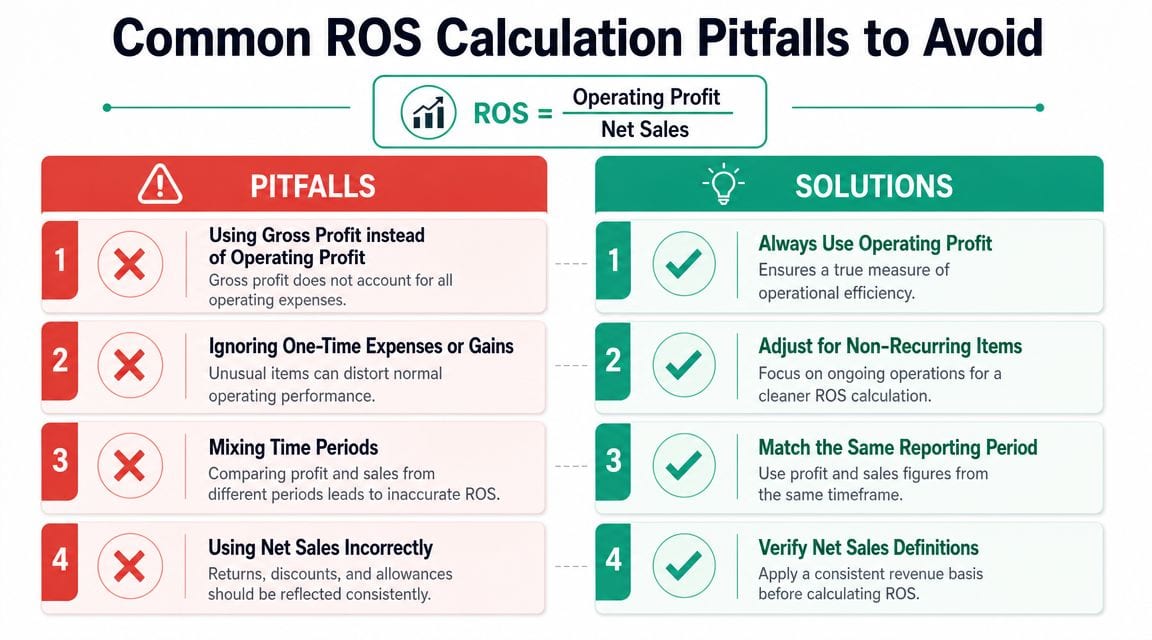
Using the wrong profitability line
Gross profit is a common substitute because it's easy to find and usually cleaner than operating profit. But it excludes many operating expenses that ROS is meant to reflect, especially selling and administrative costs.
Net income is the opposite problem. It goes too far and folds in non-operating items. Both substitutions distort the metric.
Fix: align the numerator to operating profit and document the exact account mapping behind it.
Comparing mismatched periods
This happens more often than people admit. Sales may be grouped by order date while operating expenses are grouped by posting date. Or refunds hit in a later period while sales stay in the original month.
That creates a ratio that looks tidy but compares unlike periods.
Fix: use one reporting calendar, one period definition, and one treatment for adjustments across both numerator and denominator.
Ignoring refunds and discounts
This pitfall is especially common in marketing and ecommerce reporting. Teams pull gross sales from the commerce platform and treat that number as final revenue. It isn't.
If refunds, returns, allowances, or discounts aren't reflected correctly, net sales will be overstated and ROS will drift upward.
A quick pitfall-to-fix reference
| Pitfall | Why it causes trouble | Better approach |
|---|---|---|
| Gross profit used in numerator | Overstates efficiency | Use operating profit |
| Net income used in numerator | Mixes in non-operating items | Keep ROS focused on operations |
| Gross revenue used in denominator | Misses returns and discounts | Use net sales |
| Mixed date logic | Breaks period comparability | Standardize calendar rules |
Treating ROS as universally comparable
ROS is useful for internal trend analysis and for comparisons where accounting treatment and business model are similar. It's much less useful when teams compare businesses with very different cost structures or reporting conventions.
The fix here is judgment, not a formula tweak. Use ROS to compare like with like. If the context changes, your interpretation should change too.
A clean ROS trend inside one business is usually more valuable than a shaky benchmark against a very different one.
One more operational warning: if your team revises historical data, restates returns, or changes expense mapping, annotate those periods. A mathematically correct ratio can still be analytically misleading if its definition shifted midstream.
Guarantee Data Accuracy Before You Calculate ROS
A ROS number can look polished in a board deck and still be wrong at the source. That usually happens upstream, before anyone opens a spreadsheet or writes SQL. Missing purchase events, duplicate transactions, broken tagging, delayed server-side forwarding, and schema drift all contaminate the revenue picture that later feeds financial analysis.
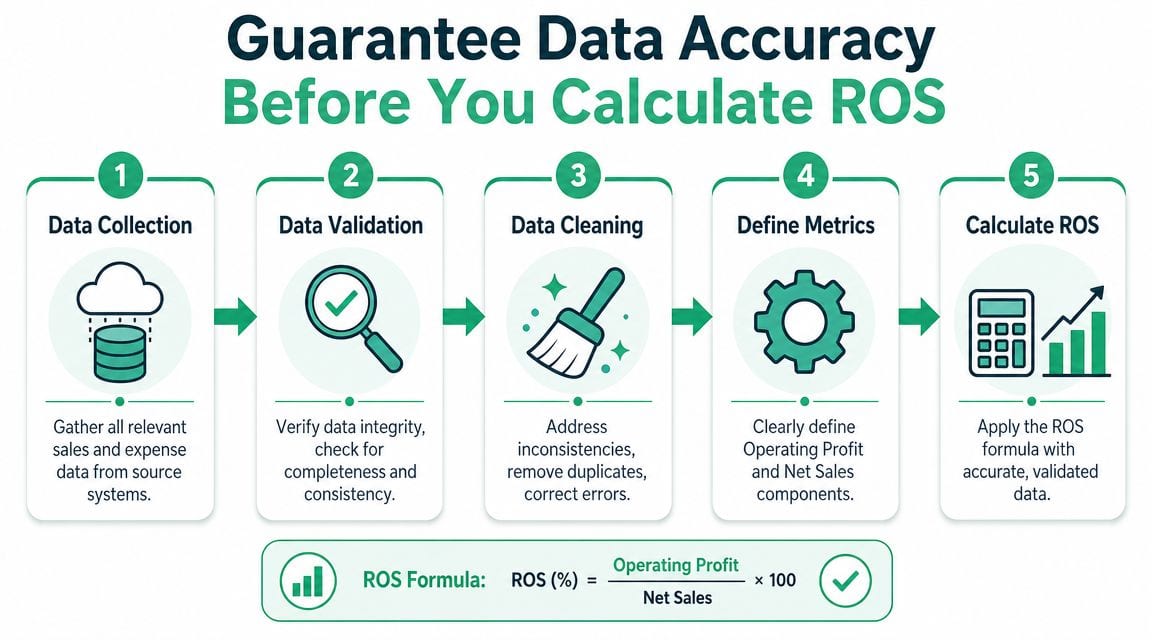
For digital teams, analytics QA directly impacts financial reliability. If your analytics implementation breaks unnoticed, the damage doesn't stay inside marketing reports. It can influence the assumptions teams use to validate sales data, diagnose margin changes, or explain why ROS moved.
Where bad data usually enters the process
The weak points are rarely dramatic. They're usually routine changes that no one catches fast enough:
- Tagging updates: a release changes event names or drops key parameters.
- Consent and privacy changes: some traffic stops sending expected events.
- Channel tagging errors: campaign attribution becomes incomplete or inconsistent.
- Destination failures: one platform receives the event, another doesn't.
Build checks before the metric, not after it
You can catch some of this with manual QA, warehouse tests, and dashboard spot checks. For many teams, that's still the baseline. But the main limitation is coverage. Manual review won't reliably detect every silent break across web, app, and server-side flows.
That's where a tool like Trackingplan's data quality best practices becomes relevant as a working model. In practice, teams use observability workflows and automated QA to monitor data layers, analytics events, pixels, schema changes, and tagging issues before those problems pollute reporting. Trackingplan is one example of a platform built for that type of monitoring across analytics implementations.
If you want to add video material for the team, Trackingplan also publishes walkthroughs on the Trackingplan YouTube channel, which can be useful when you're explaining analytics QA concepts internally.
The important point isn't the tool name. It's the operating discipline. If you only validate ROS after the metric looks suspicious, you're already late. Reliable ROS comes from trusted inputs, documented definitions, and continuous checks on the systems generating the data.
Clean formulas don't rescue dirty inputs. Data quality has to be part of the metric design.
When analysts and marketers adopt that mindset, ROS becomes much more than a finance ratio. It becomes a dependable signal for operational decisions.
If your team wants ROS and other business metrics to rest on trustworthy analytics data, Trackingplan helps monitor events, pixels, schema changes, campaign tagging, and other implementation issues before they distort reporting.