Build a rock-solid analytics change management process. Our guide provides a step-by-step framework for governance, testing, & monitoring, ensuring data you
A campaign goes live. Paid traffic lands on the site. The dashboard shows sessions, but conversions are flat or missing. Marketing thinks the tag manager publish broke attribution. Product thinks the event schema changed. Engineering says nothing customer-facing failed, so the release was fine. By the time someone confirms what happened, the team has already lost confidence in the numbers.
That's the underlying problem behind analytics change management. It's not just broken tags. It's broken trust.
Organizations don't fail because they lack dashboards. They fail because they let analytics changes happen through side doors: a quick GTM edit, a renamed event property, a pixel added by an agency, a consent tweak that nobody validated against downstream reporting. Those changes look small in isolation. In production, they can severely poison attribution, experimentation, budgeting, and executive reporting for days.
Why Unmanaged Analytics Changes Wreak Havoc
Analytics rarely breaks in dramatic ways. More often, it drifts. A developer changes a checkout component and an event stops firing on one browser. A marketer adds a new campaign parameter that doesn't follow naming rules. A product squad ships a new flow and sends the same event name with different properties. Reports still populate, so the issue survives long enough to influence decisions.
That pattern is bigger than analytics alone. Between 60% and 70% of organizational change efforts fail to achieve their intended goals, and McKinsey notes that 70% of initiatives fail because of employee resistance and lack of management support in the human side of change (McKinsey on the human side of change). In analytics programs, those same failure modes show up as unclear ownership, weak review processes, and teams treating instrumentation as an afterthought.
Small tracking changes create large reporting consequences
The damage usually starts upstream and appears downstream.
- Tag changes distort attribution: A missing campaign parameter or broken pixel can make channels look weaker than they are.
- Schema changes corrupt dashboards: If one team renames or repurposes a property without warning, historical trends become harder to trust.
- Unreviewed releases create blame cycles: Marketing, analytics, engineering, and agencies all see a different part of the failure.
Broken analytics usually isn't one catastrophic error. It's a chain of unowned changes that nobody validated end to end.
That's why analytics change management has to be treated as an operating system, not a cleanup task. You need a repeatable way to request changes, approve them, test them, release them, and monitor them after launch.
If you're already seeing symptoms like unexplained drops, duplicate events, or channels that suddenly stop converting, this list of signs your analytics is broken and how to fix it will feel familiar.
Laying the Foundation with Clear Governance and Roles
Most analytics chaos starts with one sentence: “I thought someone else owned that.”
Governance fixes that. Not by adding paperwork, but by making ownership explicit before a change ever reaches production. Teams move faster when they know who can request a change, who approves it, who implements it, and who signs off on data quality.
McKinsey found that digital transformation success rates increase by a factor of 3.5 when companies clearly communicate desired outcomes and roles before launching new solutions (McKinsey on clear roles and outcomes). Analytics programs are no different. If roles stay fuzzy, instrumentation becomes tribal knowledge and every release becomes riskier than it needs to be.
The minimum governance model that actually works
You don't need a massive committee. You need a small decision structure with authority.
A practical setup usually includes:
- A business owner: Prioritizes requests based on business impact.
- An analytics owner: Guards the tracking design, naming standards, and downstream usability.
- An implementation owner: Handles web, app, or server-side deployment details.
- A QA owner: Validates that the change behaves correctly before and after release.
For cross-functional teams, a monthly or biweekly data council helps. Its job isn't to micromanage every event. Its job is to decide what gets prioritized, what gets blocked, and what must be redesigned before release.
Analytics Change Management Roles and Responsibilities
| Role | Primary Responsibility | Key Tasks |
|---|---|---|
| Data Strategist | Owns measurement design and governance | Defines event taxonomy, approves tracking requirements, aligns changes to reporting needs |
| Marketing Stakeholder | Connects change requests to campaign and attribution needs | Submits business context, validates campaign parameters, confirms downstream reporting use |
| Developer | Implements the technical tracking change | Updates dataLayer, SDK, pixel logic, event triggers, and destination mappings |
| QA Analyst | Verifies data quality before and after release | Tests firing logic, validates payloads, checks schema consistency, confirms no critical regressions |
| Product Manager | Prioritizes requests against roadmap impact | Confirms user journey implications, coordinates release windows, resolves trade-offs |
| Data Engineer or Analytics Engineer | Protects downstream pipelines and models | Reviews schema effects, checks warehouse compatibility, validates transformations |
| Data Council or Steering Group | Makes cross-team decisions | Approves major changes, resolves ownership disputes, enforces standards |
A governance model only works if it's visible. Put it in the same place as your tracking plan, naming standards, and release process. If people have to ask who owns analytics, governance already failed.
Practical rule: Every analytics change should have one requester, one approver, one implementer, and one validator. If any of those roles are blank, the change isn't ready.
If you need a starting point for the operating model itself, this guide on data governance for analytics is useful because it frames governance as a delivery discipline, not a compliance exercise.
The Change Workflow From Request to Tracking
A good workflow removes ambiguity before code is written. It also makes “quick analytics tweaks” harder to sneak into production without context.
The core document is the change request. If your team can't describe the business objective, affected surfaces, expected payload, and validation criteria, the request isn't ready for implementation. That sounds strict. It's cheaper than fixing broken reporting after a release.
A simple workflow is enough if every step has an owner and an exit condition.
What every change request should include
The request should force the requester to answer a few essential questions:
Business objective
What decision will this data support? “Track CTA click” is not enough. “Measure trial-start intent from pricing page variants” is.Affected platforms
Web, iOS, Android, server-side, CRM sync, ad destinations, or warehouse pipelines.Tracking specification
Event name, trigger logic, required properties, expected values, and any dependencies.Downstream impact
Which dashboards, audiences, attribution models, or experiments depend on the change?Release and validation criteria
What has to be true for this change to count as successful after deployment?
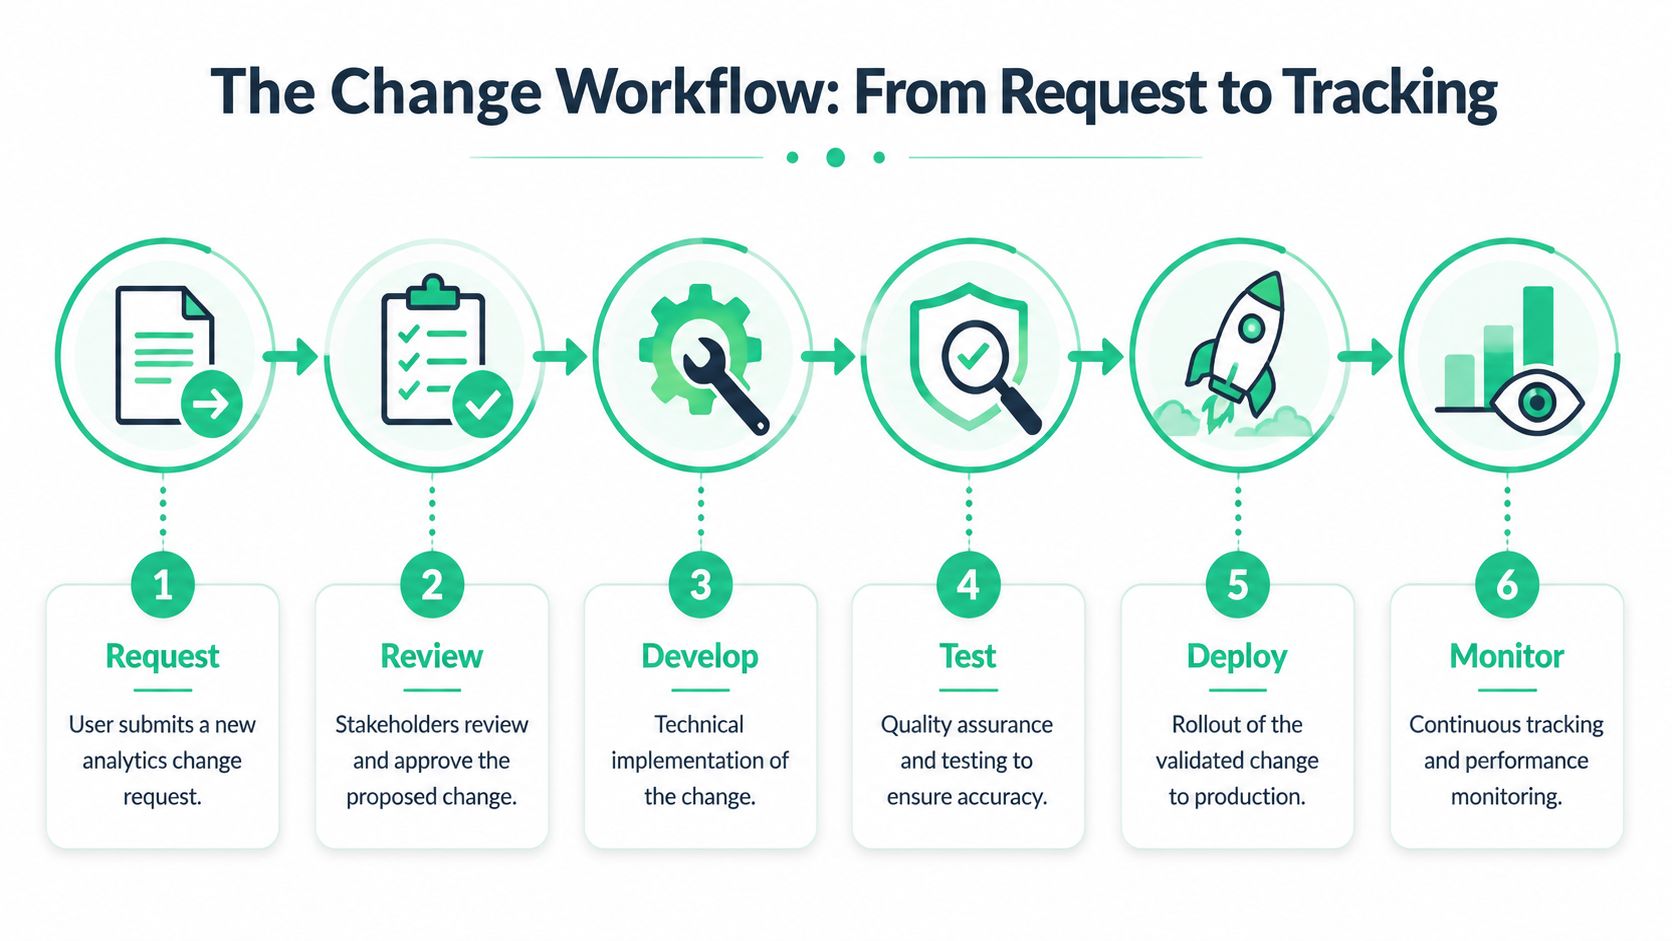
The six-step operating flow
Teams can run this in Jira, Asana, Linear, or even Trello, as long as status means something.
- Request: The requester submits the business need with the spec.
- Review: Analytics and business owners approve, reject, or rewrite the request.
- Develop: Engineering or tag management resources implement the change.
- Test: QA checks payloads, triggers, consent behavior, and destination delivery.
- Deploy: The change moves to production in a controlled release.
- Monitor: The team watches for anomalies, schema mismatches, and downstream breakage.
A tracking plan sits in the middle of this workflow. It isn't a static spreadsheet you update once a quarter. It's the reference that tells teams what should exist, how it should be named, and what “correct” means. That's also why a short explainer like what a tracking plan is is useful for getting non-technical stakeholders aligned on why this document matters.
If the workflow lives only in Slack threads and memory, you don't have a workflow. You have a queue of future incidents.
What doesn't work
Some patterns fail almost every time:
- Drive-by requests: “Can we add this pixel today?” with no business context.
- Unversioned specs: Teams test against one definition and deploy another.
- Approval without validation criteria: Stakeholders say yes, but nobody defines what success looks like in data.
- Status theater: Tickets move to done when code ships, not when data is verified.
A strong workflow gives you traceability. When something breaks, you can identify what changed, who approved it, what was expected, and where validation failed.
Your Safety Net Automated QA and Testing
Manual QA catches obvious problems. It doesn't reliably catch analytics drift.
A person can open DevTools, trigger a few events, and confirm that something fired. That's useful. It's also shallow. It won't consistently detect rogue properties, destination mismatches, broken consent behavior, campaign tagging issues, or a schema change that only appears on one template or app version.

Test the implementation in layers
Analytics QA works better when you separate what you're trying to prove.
Unit testing checks the local behavior. Did the tag fire? Did the dataLayer push occur? Did the SDK call include the required fields?
Integration testing checks whether the event survives the full path. Did it reach Google Analytics, Adobe Analytics, Segment, Mixpanel, or the warehouse with the correct schema and values?
Smoke testing checks whether the release broke something critical. Can core conversion journeys still be tracked end to end after deployment?
These layers matter because analytics failures often hide in handoffs. The click event exists in the browser, but never reaches the destination as expected. Or it reaches the destination, but a downstream pipeline can't use the changed property structure.
Why automated observability changes the game
Manual QA is a point-in-time activity. Analytics observability is continuous. That difference matters when multiple teams, agencies, release trains, and Martech tools are touching the same implementation.
One option in this category is Trackingplan, which automatically discovers analytics implementations, compares them against the expected setup, and monitors issues such as schema mismatches, rogue events, missing pixels, campaign tagging errors, and potential consent or PII problems across web, app, and server-side stacks. Used well, tools like this move QA earlier and keep watching after release instead of relying on periodic audits.
For teams trying to reduce release risk, the discipline behind shifting left in analytics testing is more important than the tooling itself. The principle is simple: catch analytics defects before they become reporting defects.
A short product demo helps show what automated checks look like in practice:
Decision rules for acting on failures
The practice of “measuring and adjusting” is already common. The missing piece is deciding what action each failure triggers.
Use simple rules:
- Pause release when a core conversion event is missing, duplicated, or materially altered.
- Rollback when a change causes obvious reporting corruption or breaks a critical destination.
- Hotfix when the issue is isolated, understood, and safe to correct without broader risk.
- Document and defer when the issue is real but low-impact, with no immediate business exposure.
The job of QA isn't to prove a release is perfect. It's to prove the remaining risk is understood and acceptable.
Go-Live Smart Rollouts and Continuous Monitoring
Production is where analytics change management becomes real. A clean ticket, a reviewed spec, and successful QA still don't guarantee a safe launch. You need a deployment strategy and a monitoring window with clear success criteria.
Teams that release analytics changes in smaller, feedback-driven increments generally do better than teams that treat launch as a one-time event. One synthesis reported 42% success rates for Agile-style approaches versus 13% for Waterfall, and another comparison found 64% versus 49% in favor of Agile, with the same source also citing a meta-analysis where iterative projects finished 28% faster on average (research summary on iterative change methods). For analytics, the operational takeaway is straightforward: shorten the loop between release, validation, and correction.
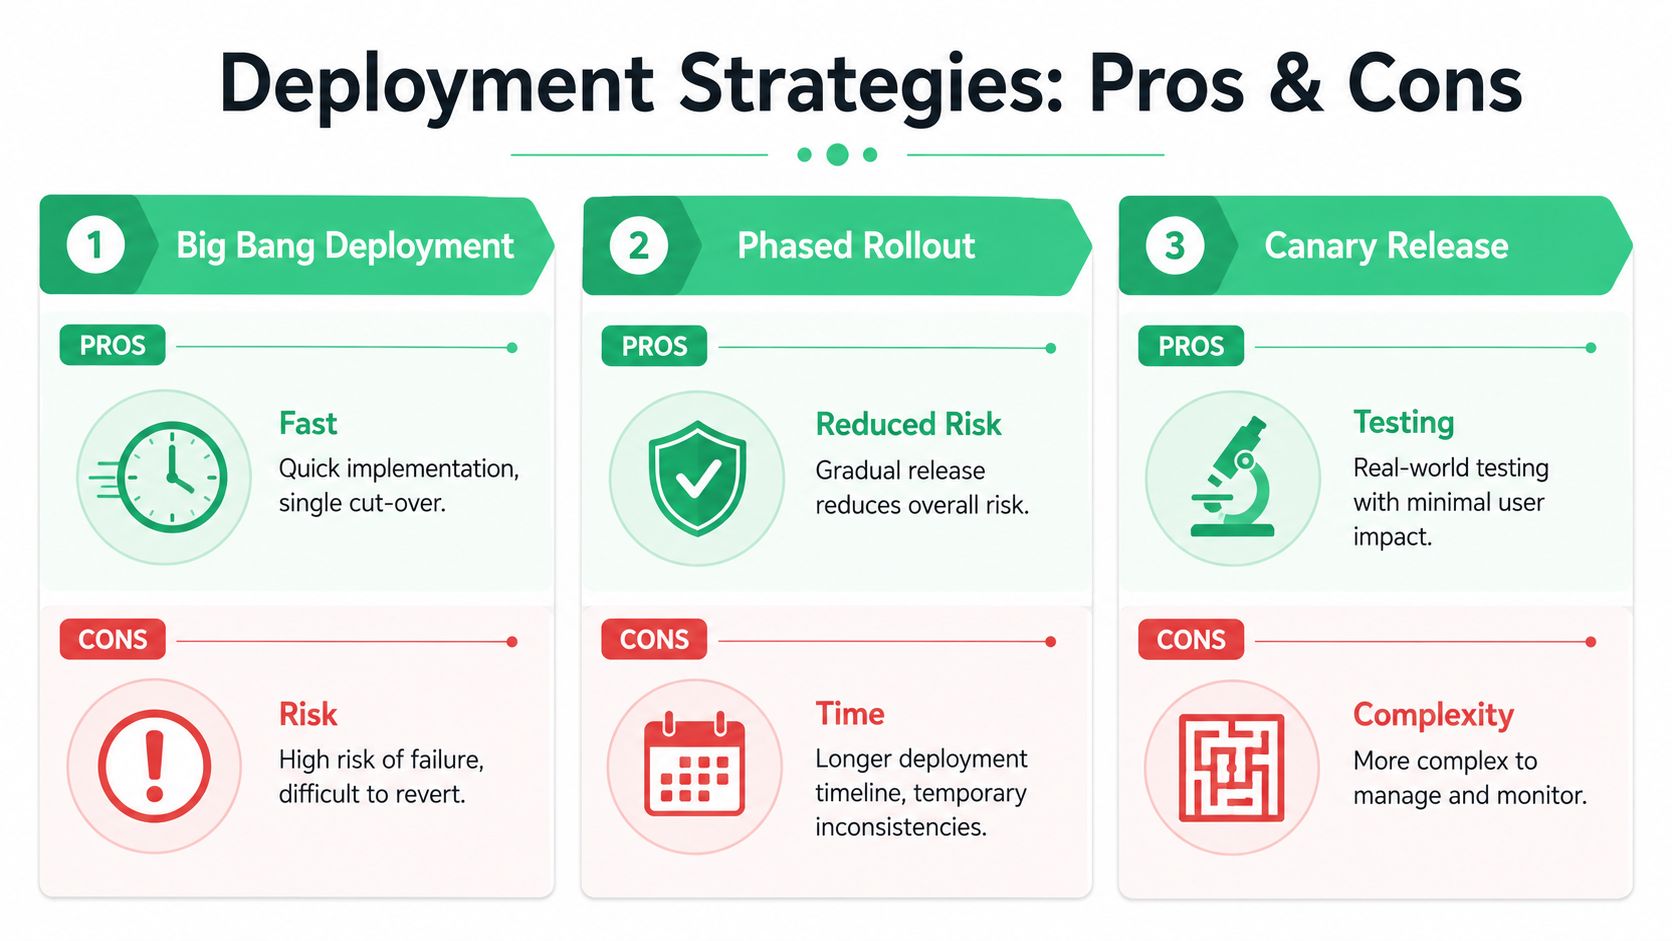
Choose the rollout pattern on purpose
Not every analytics change deserves the same launch strategy.
Big bang deployment fits low-complexity changes with limited blast radius. It's fast, but if the implementation is wrong, the error reaches everyone at once.
Phased rollout works when the change touches multiple properties, teams, or reporting layers. It takes longer, but it localizes confusion and gives analysts time to validate each slice.
Canary release is usually the safest option for high-risk changes. Expose the implementation to a small user segment first, inspect the payloads and downstream reporting, then expand only if the data is clean.
Define success before release
A practical metric is Change Success Rate = successful changes ÷ total implemented changes × 100%, using a fixed post-change window such as 24 to 72 hours to classify whether the change shipped as planned, avoided rollback or backout, and caused no attributable P1 or P2 incident or material SLO breach (change success rate reference).
That formula matters because “it deployed” is not the same as “it succeeded.”
Useful supporting KPIs include:
- Change failure rate: Which releases caused breakage or required rollback.
- Backout rate: How often the team had to reverse a change.
- Incident count per change: Whether certain request types create repeated risk.
- Error-budget burn after deployment: Whether the release consumed reliability budget.
- Lead or cycle time: Whether speed is improving at the cost of quality.
The same reference also recommends looking at both count-weighted and severity-weighted success, because a high raw success rate can hide a small number of damaging analytics failures.
Monitor immediately, not next week
The first minutes and hours after release tell you more than a retrospective dashboard review ever will.
Watch for:
- Traffic anomalies: Sudden drops or spikes in critical events.
- Schema mismatches: New fields, missing required properties, or value-type changes.
- Destination failures: Pixels or endpoints that stop receiving what they should.
- Tagging issues: UTM or campaign naming changes that break attribution hygiene.
If you need a framework for what to watch and how to operationalize it, this step-by-step guide to analytics monitoring for accurate tracking is a practical complement to the release process.
Closing the Loop Stakeholder Communication and Adoption
Even a solid process can fail if people see it as overhead. Analytics change management sticks when teams feel that the process helps them ship safer, not slower.
That means communication has to be operational, not ceremonial. Stakeholders don't need a long manifesto about data quality. They need to know what changed, when it changed, what they're expected to do, and what happens if the rollout creates issues.

Use short communication assets people will actually read
Keep the process visible through lightweight artifacts:
- Change announcement: What is changing, why it matters, who is affected, and when it ships.
- Release note: What was deployed, what was validated, and what needs observation in the post-release window.
- Data dictionary update: Which event names, properties, or definitions changed, and what business users should use going forward.
- Escalation note: Who to contact if dashboards or downstream tools look wrong after launch.
A message to business stakeholders can be plain language. “Checkout_started now includes plan_type and billing_period. Existing dashboards remain valid. Revenue attribution reports should be watched during the first post-release window.” That's enough.
What to do when adoption is low
Many programs frequently stall. They collect workflow data, but they don't attach actions to it.
A more useful approach is to connect behavioral signals to interventions. The gap is common: many guides explain how to measure adoption but don't answer the harder question of how to act when adoption is low, even though success depends on linking indicators such as usage or resistance to concrete interventions (analysis on turning adoption data into action).
Try a simple action model:
| Signal | Likely issue | Action |
|---|---|---|
| Request tickets arrive incomplete | Intake form is too vague or too technical | Rewrite the form, add examples, require fewer free-text fields |
| Teams bypass the workflow | Process feels slow or irrelevant | Add fast-lane rules for low-risk changes, publish service levels |
| Repeated QA failures from one team | Standards aren't understood locally | Run targeted enablement with examples from that team's releases |
| Business users ignore new fields | Data dictionary isn't usable | Translate technical names into reporting definitions and use cases |
Adoption improves when the approved path is easier than the workaround.
Build feedback into the system
Ask three groups different questions.
Marketing should tell you whether the process supports campaign speed. Developers should tell you where specs are unclear or unrealistic. Analysts should tell you where released changes still create ambiguity in reporting.
That feedback loop is where analytics change management becomes durable. You're not just measuring whether people complied. You're learning where the process creates friction and adjusting it before teams abandon it.
Building a Lasting Culture of Data Trust
Reliable analytics doesn't come from one heroic analyst cleaning up dashboards after every release. It comes from a system that makes bad changes harder to ship and good changes easier to validate.
That system has a few visible traits. Ownership is clear. Requests are documented. Testing happens in layers. Releases use deliberate rollout patterns. Monitoring starts immediately. Communication tells people what changed and what to watch. When those pieces are in place, the work stops feeling chaotic.
The biggest payoff is trust. Marketing trusts attribution more. Product trusts experiment reads more. Leadership trusts the dashboard in the meeting more. Teams also stop wasting energy on the same arguments about whether the problem lives in the tag, the pipeline, the report, or the user.
Analytics change management is ultimately a discipline of prevention. You still need people who can investigate incidents. But the stronger move is building an environment where fewer incidents reach decision-makers in the first place.
That's what mature teams protect. Not perfect instrumentation. Trustworthy data.
If you want a practical way to operationalize this, Trackingplan helps teams monitor analytics implementations continuously, detect unexpected changes, and keep tracking plans aligned with what's running in production.