HTTP Status -1: A Dev's Guide to Fixing Failed Requests
Getting an HTTP status -1 error? Learn what this client-side failure means, its common causes like CORS or blocked requests, and how to debug it fast.
David Pombar
Swiss army knife at Trackingplan
June 3, 2026
TL;DR
You open DevTools, reload the page, and one analytics request shows (failed). There's no clean 404, no useful 500, and nothing obvious in your server logs. Meanwhile, marketing is asking why conversions look light, product wants funnel numbers, and your dashboard suddenly has gaps you can't explain.
That's the core frustration behind HTTP status -1. It usually appears right where you expected a normal request lifecycle, but the request never made it far enough to produce a valid HTTP response. For analytics engineers, that matters because missing hits don't just create technical noise. They create attribution holes, dropped events, and reporting drift that teams often misread as a tagging bug or backend outage.
The Mystery of the Failed Web Request
A proper HTTP response has a familiar shape. HTTP status codes are three-digit values returned in the response header, and the first digit places them into one of five classes: 1xx informational, 2xx success, 3xx redirection, 4xx client error, and 5xx server error. A normal success is 200 OK, while 4xx and 5xx indicate the request wasn't completed as intended, as outlined in IBM's explanation of HTTP status code classes and reason phrases.
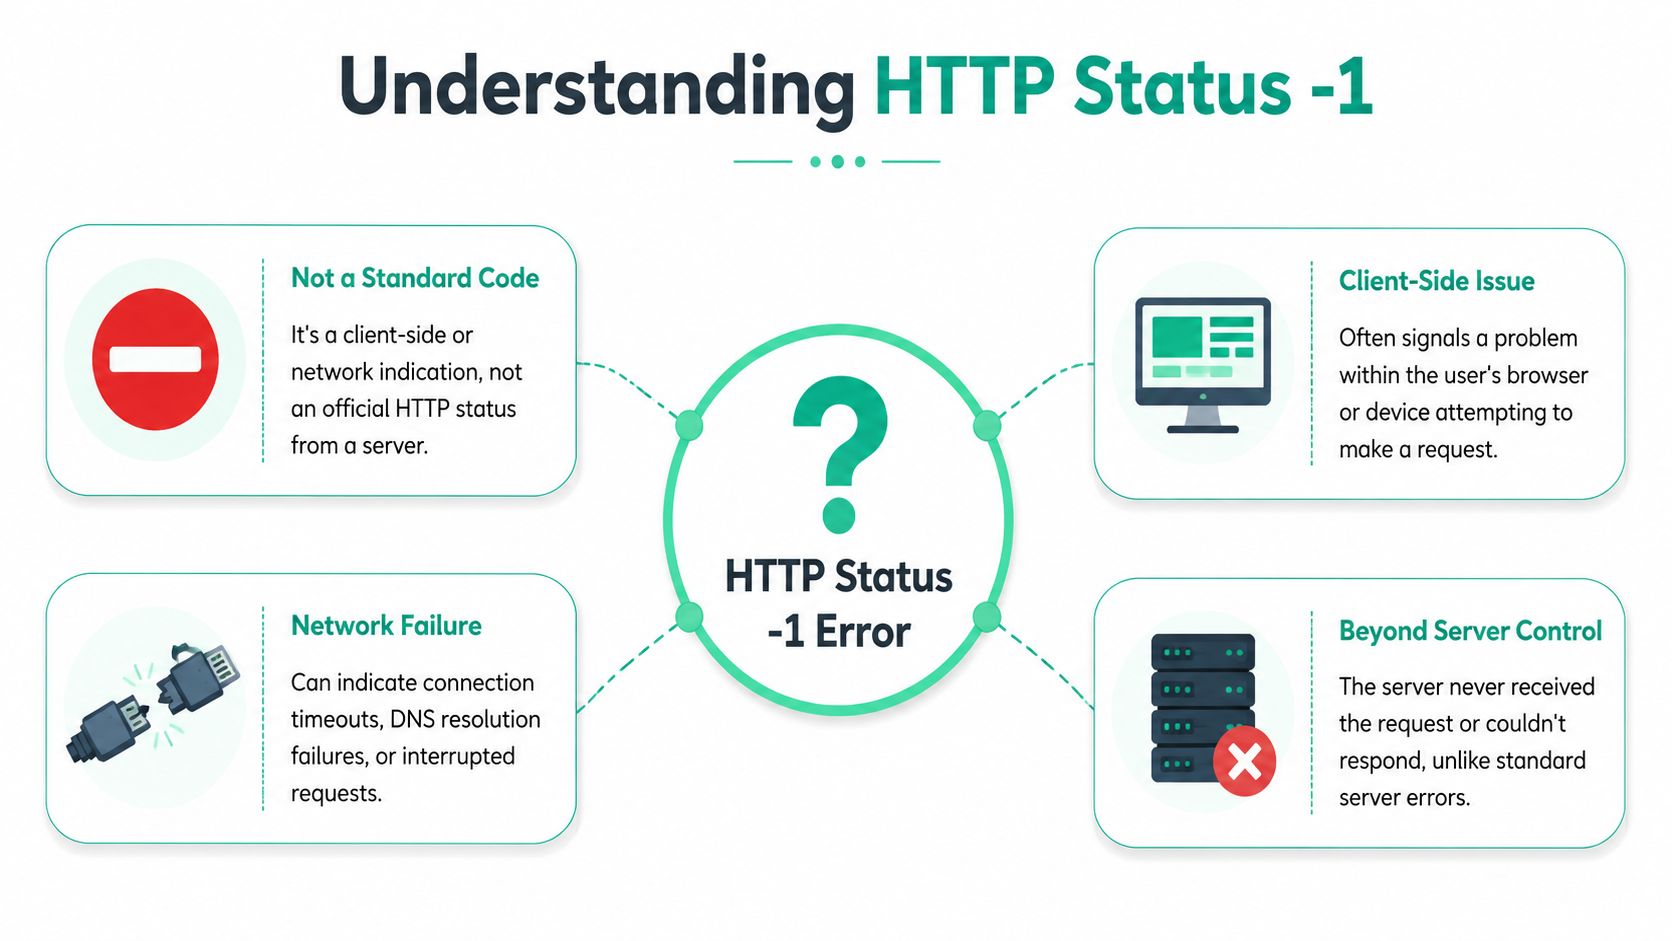
That baseline matters because -1 does not fit the HTTP model. If you see it in a browser tool, SDK log, or analytics debugger, you're not looking at an official server response. You're looking at a client-side representation of a request that failed before a valid HTTP status line could be parsed.
For analytics work, teams often lose time. They start by checking the endpoint, the tag manager, or the vendor status page. Sometimes that's useful, but often it isn't. A failed pixel can come from the browser, the network path, an extension, a policy restriction, or a page navigation that interrupts delivery before the request finishes.
Practical rule: If you see status -1, treat it first as a delivery failure, not as proof of an origin server bug.
That changes how you investigate. Instead of staring only at application logs, you need to inspect the browser's request chain and think in layers. Teams that already use synthetic monitoring for web reliability know this pattern well. A request can fail for the user even when the origin itself is healthy.
What an HTTP Status -1 Error Actually Means
HTTP status -1 isn't a real HTTP status code. Standard HTTP statuses are three-digit numbers. A reported value of -1 is usually a sentinel used by a browser, app, or library to indicate that no valid HTTP response was received, or that the request failed before a status line could be parsed, as described in this HTTP status code glossary explanation of status -1.
Think of it as a delivery that never reached the protocol layer
A 404 means the server answered and said the resource wasn't found. A 500 means the server answered and said it had a problem. Status -1 usually means the client never got a valid answer at all.
A simple analogy helps. A 4xx or 5xx error is like a letter that reached the destination city but couldn't be delivered. -1 is like a letter that never left the local sorting center, got blocked in transit, or was canceled before it was sent.
That's why the same failure can look different across environments. The browser, mobile SDK, analytics wrapper, or QA tool may each label the event differently even when the root problem is similar.
How different tools tend to present it
Tool / Browser
Typical Representation in Network Tab
Common Console Message
Chrome
(failed)
net::ERR_FAILED or a more specific network/CORS message
Firefox
Failed request entry
NS_ERROR_FAILURE or a related network/security message
Safari
Failed or canceled request entry
Browser-specific network or policy error text
Fetch or XHR wrappers
-1 or no status available
Generic request failed, aborted, or network error
Analytics SDKs and custom monitors
status: -1
Client-defined failure indicator
The exact wording varies, but the operational meaning is usually the same. The browser didn't receive a syntactically valid HTTP response it could expose as a proper status code.
When the browser shows -1, the first question isn't “Which HTTP error was this?” It's “Which layer failed before HTTP completed?”
That shift sounds small, but it changes your debugging path. You stop expecting the server to explain the failure, and you start examining the client environment, browser policies, network resolution, transport setup, and request timing.
Common Causes for Analytics and Tracking Pixels
Treat HTTP status -1 as a symptom class, not a single bug. That framing matters because similar-looking failures can come from very different layers. For analytics and marketing pixels, that distinction is especially important. A blocked conversion request, a canceled pageview beacon, and a DNS problem may all appear as failed delivery, but the fix is completely different.
The practical gap in most explanations is that they stop at “it's not a real HTTP code.” What helps teams is separating browser and fetch failures, CORS and network issues, DNS and TLS problems, and abort scenarios that break tag delivery across web, app, and server-side stacks, as discussed in this analysis of status -1 as a symptom class for debugging.
CORS failures
Analytics often sends data cross-origin. Your site runs on one domain, while the endpoint lives on another. If the browser decides the cross-origin request violates CORS policy, the request may appear as failed before your application gets a usable response.
This is one of the easiest ways to misread the issue. The endpoint may be alive and healthy, yet the browser still blocks the call. When that happens, analysts tend to blame the vendor or the release when browser policy enforcement is the problem.
Look for console messages that explicitly mention CORS. If you only watch the Network tab, you can miss the explanation and assume the endpoint is unstable.
Ad blockers and privacy tools
Many requests that look technically correct are blocked because the URL pattern, hostname, or script source resembles tracking infrastructure. The browser extension or privacy tool stops the request locally. The request never behaves like a normal HTTP transaction, so your logs on the destination side may show nothing.
This is why a tag can work on your machine and fail for a subset of users. It also explains why “the endpoint is up” doesn't settle the question. Availability at the server doesn't mean deliverability in the browser.
DNS and TLS problems
Some failures happen before the request can even establish a usable connection. DNS resolution can fail. TLS negotiation can fail. The browser can also hit proxy or local network issues that prevent the request from getting far enough to produce a valid status.
These issues are easy to underestimate in analytics because the tagging code itself looks fine. The implementation hasn't changed, but the request path still breaks.
Browser aborts and navigation timing
A surprising number of analytics requests fail because the page lifecycle cuts them off. The user clicks through quickly, the tab closes, a route transition interrupts the call, or the browser deprioritizes background work.
That's common with pixels fired late in the session or tied to unload-style logic. Engineers often think of this as a tag problem, but it's really a timing problem.
Field note: If a request fails mainly during page exit, redesigning when you send it usually works better than trying to “retry harder.”
Content Security Policy restrictions
A strict Content Security Policy can block connections to endpoints that aren't explicitly allowed. The page loads. Your tag runs. The request still fails because the browser enforces policy before the network exchange completes.
This is common after security hardening projects, consent platform rollouts, or domain migrations. The analytics team sees missing hits. Security sees a policy working as designed.
What works and what doesn't
A few patterns consistently help:
Check the browser console first. CORS and CSP failures often explain themselves there.
Compare browser states. Test with and without extensions, consent banners, and private browsing.
Group failures by endpoint and tag type. One noisy destination can make the whole implementation look broken.
What usually doesn't work is treating every -1 as if it came from the same cause. That leads to scattered fixes, duplicated effort, and a lot of false backend alarms.
A Step-by-Step Debugging Workflow
When a request shows status -1, the fastest path is a layered workflow. Start at the browser. Then isolate the environment. Then test the endpoint outside the page. The core idea is simple: if the browser only exposes a real status after receiving a syntactically valid HTTP response, then a reported -1 usually points to transport, DNS, TLS, proxy, CORS, or client-abort issues rather than your origin handler, as explained in this observability-focused guide to distinguishing pre-response failures.
Start with the browser evidence
Open DevTools and inspect both the Network and Console tabs. The Network tab tells you which request failed. The Console often tells you why.
Check these first:
Request timing. Did the request start and then get canceled during navigation?
Initiator. Was it fired by a script, a tag manager template, an image beacon, or fetch/XHR?
Console errors. CORS, CSP, mixed content, and extension blocking often show up there more clearly than in the Network panel.
If you only inspect the failed row and ignore surrounding context, you'll miss the pattern. Look at requests immediately before and after it.
Reproduce outside the original browser state
If the request fails in your normal browser profile, try to reproduce it in a cleaner environment. Use a private window. Disable extensions temporarily. Test another browser. If the failure disappears, you've already narrowed the problem substantially.
Many teams save hours. They stop arguing about whether the endpoint is down and start identifying whether the request is environment-specific.
Use a short checklist:
Extensions off to rule out ad blockers and privacy tools
Fresh session state to catch consent and cookie-path issues
Alternate browser to spot browser-specific behavior
Different network if a local proxy or corporate filter might interfere
Test the endpoint separately
After that, test the destination independently with a tool such as cURL or Postman. You're not trying to perfectly mimic the browser. You're trying to answer a narrower question: can this endpoint respond normally when browser restrictions are removed?
If cURL or Postman gets a valid response but the browser still shows a failed request, the browser environment is the likely culprit. If the independent test also fails, then the problem may sit lower in the network path or at the destination itself.
Later in the investigation, video walkthroughs can help teams align on how to inspect payloads, failures, and QA checks in practice:
Decide which layer owns the fix
Once you've isolated the failure, assign it to a layer:
Layer
Typical clue
Likely next owner
Browser policy
CORS or CSP message in console
Frontend or security
Extension/privacy block
Fails only in certain browser states
Analytics or QA
Network path
DNS, TLS, or proxy-like failure
Infrastructure or platform
Request timing
Fails on navigation or tab close
Frontend implementation
Vendor endpoint
Independent tests also fail
Vendor or backend team
Don't open with “the server returned -1.” That framing sends the issue to the wrong team. Say “the client never received a valid HTTP response,” then attach browser evidence.
That one sentence prevents a lot of wasted triage.
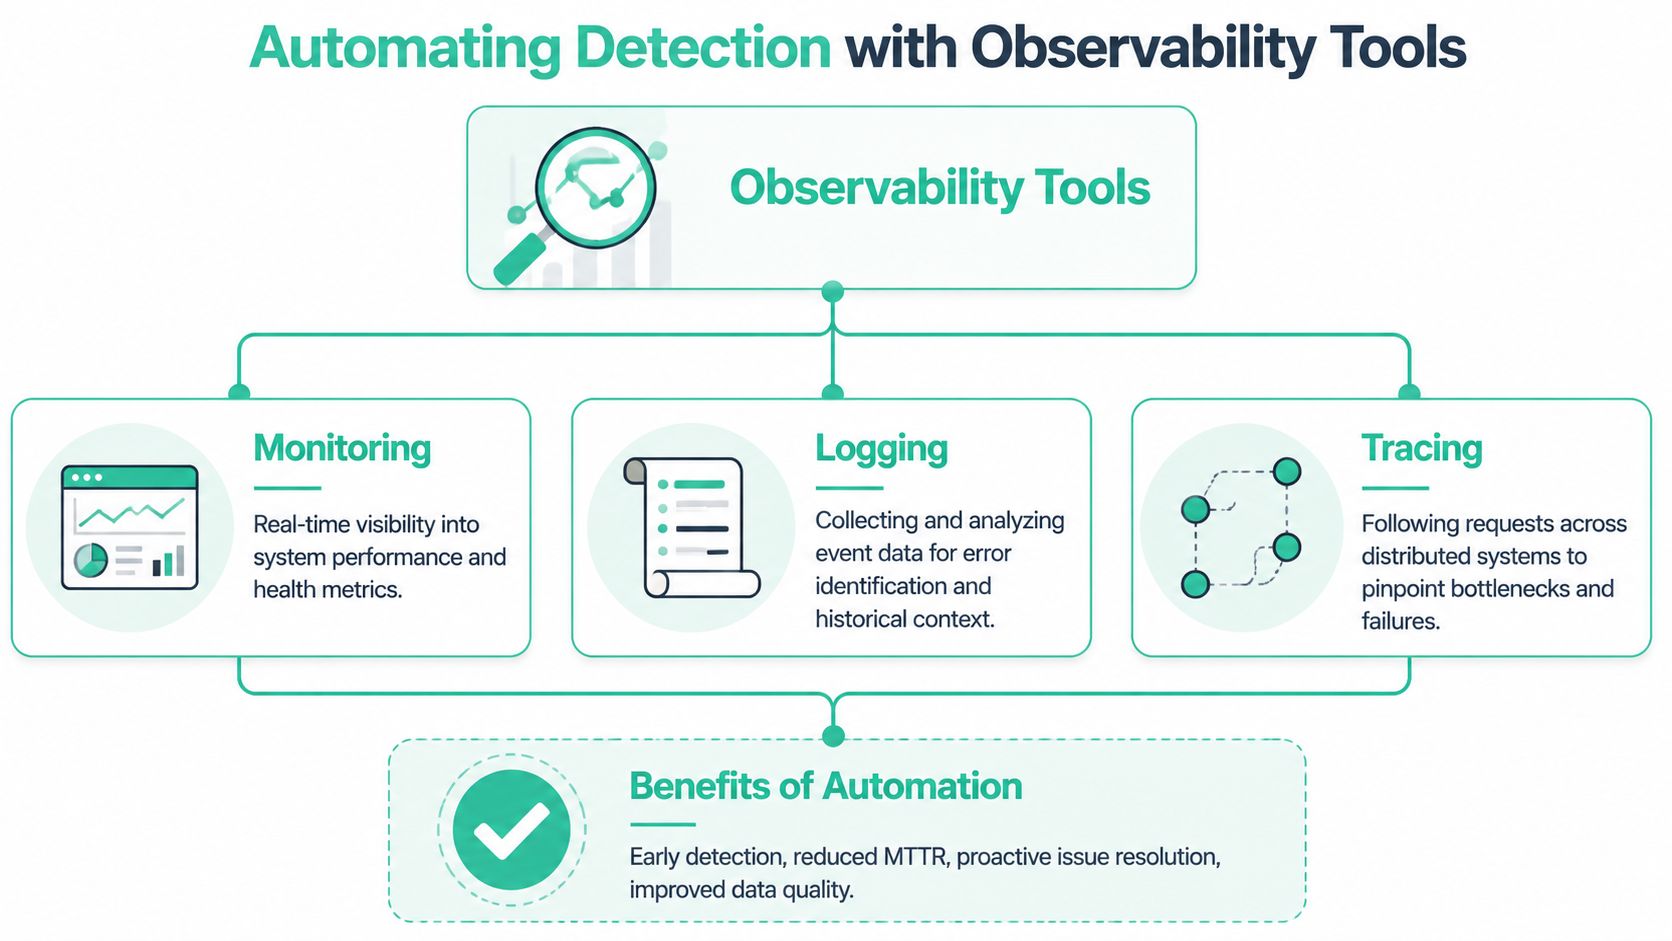
Automating Detection with Observability Tools
Manual debugging works when you're deep in a single incident. It doesn't work well when failures are intermittent, client-specific, or concentrated in only part of your audience. That's the operational problem with status -1 events. They often leave weak traces in server logs, they can depend on browser state, and they may affect only some tags, pages, or consent conditions.
The bigger challenge isn't just identifying what status -1 means. It's measuring where it happens, which endpoints are exposed, and how much business risk it creates. Practical guidance should connect these transport and client-side failures to outcomes like data loss rate, campaign-tagging completeness, and consent-related blocking, which is the gap highlighted in this discussion of operational measurement for status -1 impact.
What automation solves that manual checks can't
A browser session tells you what happened once. Observability tells you whether the same pattern is recurring and where it clusters.
That changes the conversation from “I saw one failed pixel” to questions that matter more:
Which endpoints fail most often
Which tags are most exposed
Whether failures line up with consent states
Whether the issue is isolated to one browser family or app version
Whether the impact shows up in campaign attribution or conversion reporting
Those are the questions teams need when they're deciding what to fix first.
A practical stack for recurring failures
Teams typically require some combination of:
Browser-side inspection for first discovery and reproduction
Logging and alerting for recurring implementation issues
Synthetic checks for endpoint availability outside the user browser
Analytics observability for tag-level payload monitoring and anomaly detection
This is the point where tools diverge. General observability platforms are good at infrastructure and application telemetry. They usually don't understand marketing pixels, event schemas, destination-specific payloads, or consent-conditioned behavior out of the box.
For analytics-specific coverage, tools such as Trackingplan monitor analytics and marketing implementations across web, app, and server-side stacks, detect broken or missing pixels, surface anomalies, and help teams inspect what was sent. If you want a broader framing of that discipline, this overview of data observability for analytics teams is useful.
The hard part isn't proving that a failed request exists. The hard part is knowing whether it's isolated noise or a pattern that changes reporting decisions.
For a deeper look at automated QA and monitoring in practice, Trackingplan's YouTube channel is a useful follow. The embedded walkthrough above is a good starting point if your team is trying to standardize how it validates tracking at scale.
What to monitor first
If you're building a status -1 detection process, prioritize signal over volume:
Monitoring focus
Why it matters
Conversion and attribution tags
Failures here distort business reporting fastest
Consent-dependent events
They often fail in ways that don't appear in backend logs
New releases and domain changes
Policy and endpoint mismatches appear here first
Browser-segmented patterns
Client-side failures rarely affect all users equally
Teams usually get the most value when they connect technical failure categories to business outcomes, not when they collect more isolated error rows.
Frequently Asked Questions About Status -1
Can a server ever return status -1
No. A server returns standard HTTP status codes as three-digit values. If you see -1, the value came from a client, SDK, or monitoring layer that needed some way to represent a failed request without a valid HTTP response.
That distinction matters in incident triage. If the value isn't a real server response, don't describe it as if the server emitted it.
Does HTTP status -1 mean my website is down
Usually, no. It often means a specific request failed in a specific client context. The page may still load. Other resources may still work. Your origin may be healthy.
That said, if many requests fail the same way across environments, you may still have a broader transport or delivery issue. The status itself doesn't prove a full outage.
Is status -1 the same as status 0
Not always. Different tools use sentinel values differently. In practice, both often indicate that the browser didn't expose a normal HTTP response to the application, but they can show up in different APIs and failure modes.
The right move is not to debate the number in isolation. Check the surrounding evidence: console errors, initiator, timing, browser state, and whether the request can be reproduced outside the page.
Why do analytics requests show -1 more often than normal API calls
Because analytics tags often run under worse conditions. They fire cross-origin, they're exposed to privacy tools, they may depend on consent state, and many are triggered late in the page lifecycle when users leave the page.
A product API call usually has tighter engineering ownership and clearer debugging. A marketing pixel often sits at the intersection of frontend code, tag management, browser policy, and vendor delivery. That makes pre-response failures more common and harder to classify.
What's the fastest way to reduce business impact
Prioritize requests tied to reporting decisions. Conversion tags, revenue events, attribution pixels, and consent-sensitive endpoints deserve first attention. Then classify failures by cause instead of by vendor. A blocked request and a canceled request shouldn't sit in the same bucket just because both show -1.
If you do that consistently, status -1 stops being a mystery and becomes a manageable operational category.
If your team needs a practical way to catch broken pixels, missing events, and delivery failures before they distort reporting, Trackingplan is worth evaluating. It's built for analytics QA and observability across web, app, and server-side implementations, which makes it useful when status -1 problems are intermittent, browser-specific, or otherwise hard to see in ordinary backend monitoring.
David Pombar
Read more from David, a Senior Product Strategist with 18+ years in digital product development and an atypical error detection knack.
By clicking “Accept All Cookies”, you agree to the storing of cookies on your device to enhance site navigation, analyze site usage, and assist in our marketing efforts. View our Privacy Policy for more information.