
Revenue can rise fast while the business gets harder to run. Marketing reports show more conversions, paid teams defend higher spend, and growth looks healthy on the dashboard. Then finance closes the period and operating profit barely moves.
That gap is where return on sales becomes useful. It forces one blunt question: how much operating profit is left from the sales you generated?
For marketing and growth teams, that matters more than it often gets credit for. Revenue reporting is usually downstream from tracking, attribution, campaign naming, ecommerce implementation, and data reconciliation. If any of those are wrong, the business doesn't just get a messy dashboard. It gets a distorted view of profitability. Teams can end up scaling channels that look productive in analytics but don't translate cleanly into operating performance.
Beyond Revenue Growth What Really Matters
Organizations typically track revenue, conversion rate, ROAS, CAC, and pipeline contribution. Those metrics are useful, but they don't answer a finance question that affects every operating decision: are sales turning into operating profit efficiently?
Return on sales does. It looks past top-line growth and focuses on how effectively the business converts sales into operating income. The ratio is commonly defined as operating profit divided by net sales. The Open University explanation of return on sales describes it as the percentage of sales revenue left before finance costs and corporation tax, which is why analysts use it to compare performance across periods and against peers.
Why growth teams should care
A campaign can increase reported revenue and still hurt return on sales if it depends on aggressive discounts, expensive fulfillment, heavy support costs, or rising acquisition spend. Finance sees margin pressure. Marketing sees volume. Return on sales is where those two realities meet.
That makes it a strong bridge metric between commercial teams and finance teams. It doesn't reward activity. It rewards efficient activity.
Practical rule: If your dashboard celebrates revenue without showing whether operating profit is improving, you're only seeing half the picture.
For digital businesses, there is another layer. Net sales often enter decision-making through analytics systems before they are validated against financial reporting. When campaign tags break, affiliate traffic is misclassified, server-side events go missing, or returns aren't reflected consistently, your revenue picture drifts. The result is that optimization decisions can look rational in-channel and still weaken the business overall.
A lot of marketing reporting still emphasizes volume first. That approach works until growth slows or cost pressure rises. At that point, teams need a metric that can withstand scrutiny from finance, operations, and leadership. Return on sales does that better than vanity growth numbers because it asks whether the business kept enough operating profit from the sales it worked to generate.
If your team is already reviewing acquisition and retention metrics, it helps to pair them with a broader view of key analytics metrics for marketing success. The important shift is not adding more dashboards. It's making sure the dashboards connect to actual operating performance.
How to Calculate Return on Sales
A familiar reporting problem looks like this. Marketing reports strong sales from paid and affiliate channels, finance closes the month with lower net sales, and leadership asks why profit did not follow revenue. Return on sales helps resolve that gap, but only if the calculation uses the same business definitions across systems.
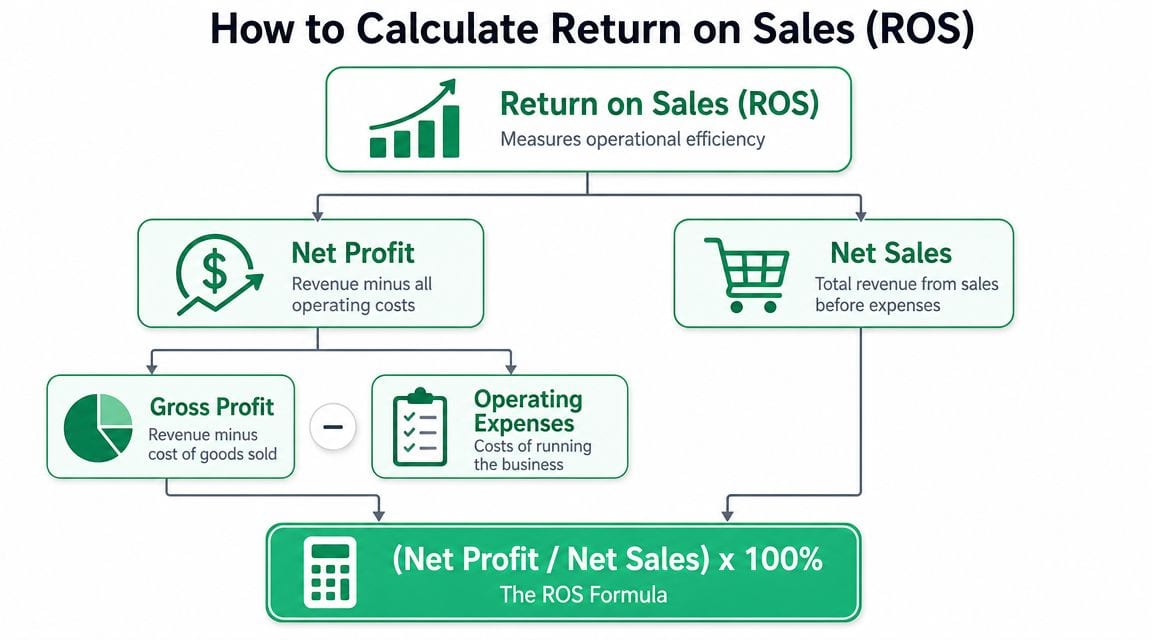
The formula is simple:
Return on sales = Operating profit / Net sales
In practice, the calculation is only as reliable as the inputs. That is why ROS sits at an interesting intersection between finance and digital analytics. Finance owns the official numbers. Growth and marketing teams influence the revenue and cost patterns behind them, and they often see those patterns first in analytics tools.
Get the definition right before you do the math
ROS is commonly treated as operating margin. It measures how much operating profit the business keeps from each dollar of net sales, before interest and taxes. The Corporate Finance Institute explains the ratio in the same terms, using operating profit over net sales as the standard formula.
That wording matters because teams often swap in nearby metrics that change the answer. Net profit is not operating profit. Gross merchandise value is not net sales. Attributed platform revenue is not recognized revenue.
The two inputs that decide whether ROS is credible
Operating profit should come from core operations. On many income statements, it appears as operating income or EBIT. This keeps the ratio focused on how efficiently the business runs, rather than on financing choices or tax position.
Net sales should reflect revenue after returns, allowances, discounts, and similar reductions. For ecommerce and subscription businesses, data quality begins to influence measured profitability. If analytics captures orders but misses cancellations, late refunds, or channel-specific discounts, ROS will look stronger than the business is. Teams already tracking ecommerce performance metrics that connect orders, returns, and revenue quality usually spot these definition gaps earlier.
A small definition mismatch can move the ratio enough to change budget decisions.
How to calculate it from real reporting
Use the income statement for the official calculation.
- Find net sales for the period.
- Find operating profit or operating income for the same period.
- Divide operating profit by net sales.
- Convert the result to a percentage.
If operating profit is 8 and net sales are 100, return on sales is 8%.
The mechanics are easy. The hard part is keeping both numbers aligned to the same period, entity, and revenue definition. I have seen teams calculate ROS on monthly marketing revenue exports while using quarterly finance costs, or use regional sales data against company-wide operating profit. The formula still works mathematically, but the business conclusion is wrong.
Where marketing and analytics teams usually go off course
The common failure is not arithmetic. It is reconciliation.
Dashboard revenue often mixes bookings, gross sales, attributed revenue, or cash collected. Finance usually reports net sales after deductions and applies consistent accounting rules. If those versions are blended together, ROS becomes a hybrid ratio that no one can defend in an operating review.
Use this rule. If finance would not sign off on the numerator or denominator, do not publish the ratio as return on sales.
What works in practice
A dependable ROS process usually includes:
- Using the income statement as the source of truth for the published ratio
- Reconciling analytics revenue to finance net sales before discussing channel efficiency
- Documenting returns, credits, and discounts clearly so the denominator stays consistent
- Matching time periods exactly across revenue and operating profit
- Separating directional dashboard estimates from the final finance-approved figure
Common mistakes are predictable:
- Using ad platform or analytics revenue without adjustment
- Mixing operating profit with net revenue from a different scope or time period
- Swapping in EBITDA automatically, which answers a different operating question
- Ignoring returns or post-purchase adjustments that reduce net sales after the initial conversion event
Return on sales becomes useful when finance, analytics, and growth teams calculate it from the same commercial reality, not from parallel reporting systems.
Interpreting Your ROS and Industry Benchmarks
A calculated ratio doesn't mean much until you put it in context. A higher return on sales generally points to stronger operating efficiency, better pricing discipline, or tighter cost control. A lower figure can signal discounting pressure, rising operating costs, or a business model that is getting more expensive to support.
The trap is assuming there's a universal target. There isn't.
Context matters more than the raw number
A company with repeatable software revenue will usually think about operating efficiency differently from a retailer managing returns, shipping costs, and promotional pressure. Even inside one market, two firms can post very different return on sales figures because their product mix, service burden, and pricing strategy are different.
That's why the best comparison is usually against:
- Your own trend over time
- Close peers with a similar cost structure
- Operational changes inside the same business
The broadest benchmark in the provided research still makes one important point. According to Qymatix, the median return on sales across all industries in the U.S. rose from 4.8% to 9.7% in 2021, which shows how sensitive the metric is to pricing, cost structures, and economic conditions, as summarized in Salesforce's return on sales guide.
A single ROS figure is a snapshot. The trend tells you whether your operating model is improving or slipping.
Use a benchmark table carefully
The brief requested an industry table, but no verified industry-by-industry figures were provided. So the right approach is to use a qualitative benchmarking table rather than invent ranges.
| Industry | Average ROS (%) |
|---|---|
| Software and SaaS | Varies by business model, pricing power, and support costs |
| Ecommerce and retail | Usually shaped by fulfillment, returns, and discounting pressure |
| Manufacturing | Often depends on input costs, utilization, and overhead discipline |
| Professional services | Influenced by billable utilization and delivery efficiency |
| Hospitality and restaurants | Sensitive to labor intensity and occupancy dynamics |
| Transportation and logistics | Closely tied to utilization, fuel, and route economics |
That table looks less satisfying than a list of percentages, but it's more honest. If you want a real benchmark, use a peer set from comparable public filings or internal competitive analysis, not a generic internet range.
For growth teams, this has a direct implication. Don't ask only whether revenue rose. Ask whether the commercial mix improved operating efficiency. A campaign that brings in more low-margin orders may improve the top line and still weaken return on sales.
If you're working in online retail, a broader set of ecommerce performance metrics helps explain why ROS changes, especially when average order value, return behavior, and channel mix move in different directions.
Questions worth asking when ROS changes
When return on sales rises:
- Did pricing improve, or did discounting fall?
- Did channel mix shift toward better-margin sales?
- Did operations become leaner without hurting delivery quality?
When return on sales falls:
- Did acquisition costs push operating expenses up?
- Did returns, refunds, or allowances affect net sales?
- Did reporting change, creating an artificial decline?
Common Pitfalls That Distort ROS Accuracy
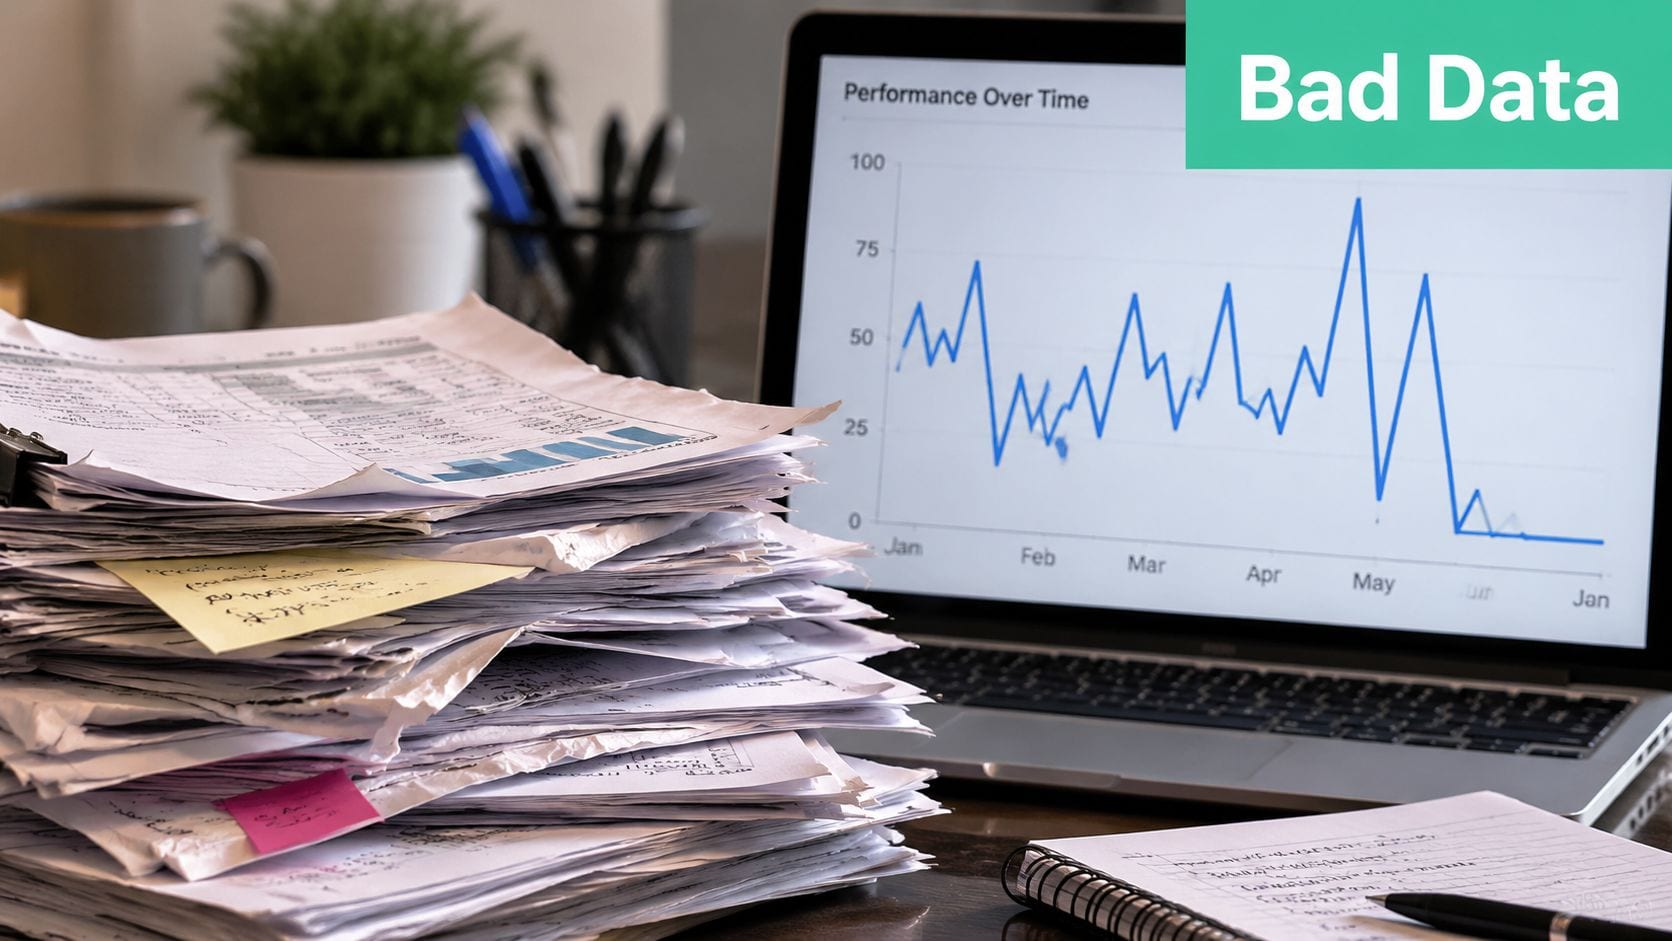
Teams often talk about return on sales as if it were a clean finance metric pulled directly from the books. In practice, the ratio is only as trustworthy as the underlying classifications and data flows. The formula is simple. The operational reality behind it often isn't.
The income statement can still be misleading
One common issue is inconsistent treatment of operating versus non-operating items. If the business reclassifies expenses between reporting periods, return on sales can appear to improve or decline even when the actual operating picture hasn't changed much.
That doesn't always come from bad intent. Sometimes finance teams change mappings after an acquisition, a restructuring, or a systems migration. But if marketing and analytics teams aren't aware of those changes, they may interpret the movement as a performance story rather than an accounting story.
Digital tracking breaks the sales side of the formula
For digital businesses, the bigger issue is often the denominator. Net sales sounds like a finance concept, but the commercial understanding of sales is usually shaped upstream by analytics tools, ad platforms, ecommerce systems, and attribution logic.
These are the distortions I see most often in practice:
- Returns hidden in analytics. The storefront records transactions cleanly, but returns and cancellations are handled in another system and never flow back into the reporting used by growth teams.
- Attribution over-crediting paid media. Paid channels claim revenue that doesn't reconcile with finance because direct, CRM, affiliate, or offline influences were flattened into a simplistic last-touch view.
- Broken event collection. Purchase events fail on some browsers, some app versions, or some checkout paths, so reported sales become a partial view.
- Campaign tagging drift. UTMs and naming conventions degrade over time, which makes channel-level profitability analysis look more precise than it is.
- Subscription recognition mismatches. Teams optimize on booked or initial order value while finance recognizes revenue differently.
Bad tracking doesn't stay in the analytics team. It changes budget allocation, channel strategy, and how leaders judge profitability.
This is also why the conversation around preventing business revenue leakage matters. Revenue leakage isn't only a billing or finance problem. It can start much earlier when customer actions, campaign data, and transaction signals fail to move consistently across systems.
Warning signs that your ROS may be distorted
A few patterns should trigger skepticism:
| Signal | What it may indicate |
|---|---|
| Analytics revenue and finance revenue rarely reconcile | Incomplete sales capture or different revenue definitions |
| Channel profitability swings suddenly without a business explanation | Tagging errors, attribution changes, or broken events |
| Return on sales changes after a tooling migration | Mapping changes or data loss in the measurement stack |
| Teams argue over "real revenue" in meetings | No shared source of truth |
If your organization is dealing with these issues, it helps to build a stronger discipline around why data quality is important for business success. Return on sales is a finance ratio, but its credibility often depends on the quality controls around marketing and product analytics.
A Practical Framework for Improving Return on Sales
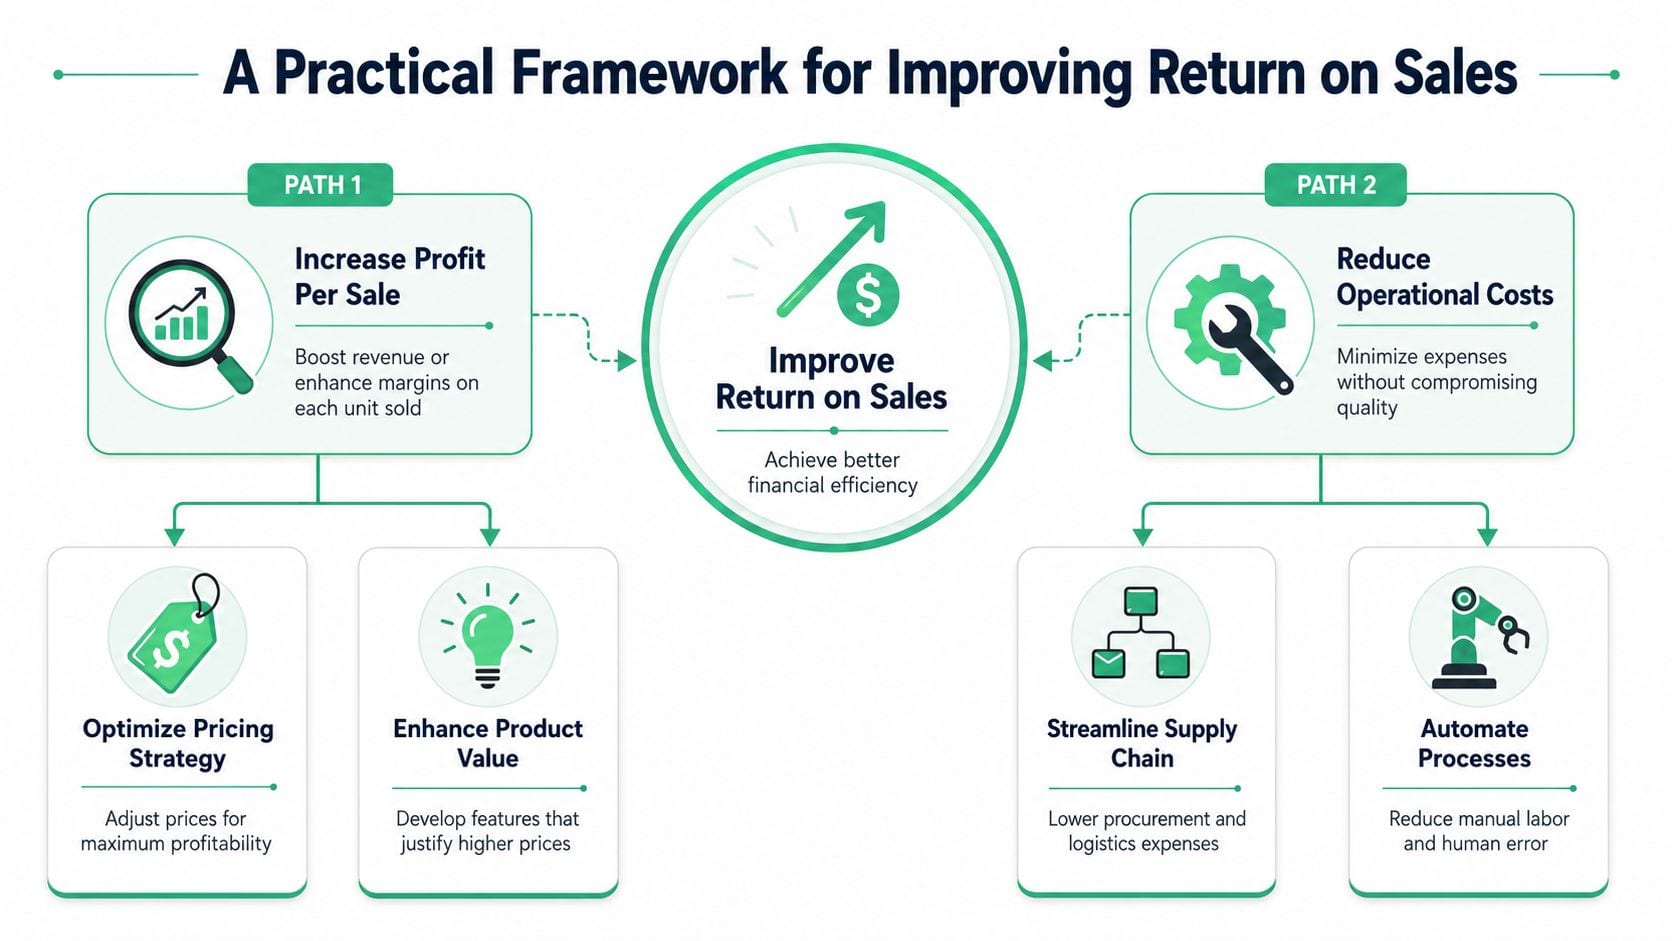
Improving return on sales usually comes from one of two directions. You either increase the operating profit generated by each sale, or you reduce the operational cost required to produce that sale. Strong teams work both sides at once.
Improve the quality of each sale
Not all revenue contributes equally to operating performance. Two channels can report similar sales volume while creating very different support burdens, return rates, fulfillment costs, or discount dependency.
The practical levers are familiar:
- Pricing discipline. Stop treating discounting as the default growth tool. Short-term volume can hide long-term margin damage.
- Product and customer mix. Some SKUs, plans, or customer segments are healthier than others from an operating standpoint.
- Conversion quality. A higher conversion rate is only useful if the resulting customers are profitable to serve.
Therefore, marketing teams often need firmer alignment with finance. The best campaign isn't always the one with the cheapest reported acquisition. It's the one that contributes efficiently to operating profit after the business carries the customer through delivery, support, and retention.
A related operational lever is funnel quality. If checkout friction, broken consent flows, or weak lead qualification push teams toward expensive remediation later, return on sales suffers. Work on the bottlenecks that reduce wasted effort, not just the ones that make dashboards look better. That's also why teams focused on growth should care about how to increase conversion in a disciplined way, not just a louder one.
Reduce the cost of operating revenue
The second path is cost control, but not the crude version where teams slash spend indiscriminately. Smart cost reduction protects customer value while removing waste.
That usually means:
- Trim non-essential operating work that doesn't improve revenue quality or customer outcomes.
- Tighten process handoffs between marketing, sales, support, and finance so errors don't multiply across teams.
- Automate repetitive checks where humans currently spot problems too late.
The most sustainable wins often come from removing preventable waste. Misfiring pixels, duplicate transactions, rogue tags, mismatched campaign naming, and broken destination mappings all create work downstream. Analysts spend time validating numbers. Marketers argue with finance. Developers hotfix tracking after launch. That waste is an operating cost, even if it isn't labeled that way in a dashboard.
Better data improves ROS decisions
This is the part many teams miss. Better data doesn't improve return on sales by magic. It improves the decisions that shape the ratio.
When the data is reliable, teams can:
- Cut channels that only appear efficient
- Protect campaigns that generate healthier commercial outcomes
- Spot funnel leaks before they become recurring margin problems
- Reconcile sales reporting with finance faster
- Reduce time spent debating whose numbers are right
A useful example from Trackingplan's channel covers the mechanics behind these problems and how teams fix them in practice:
That kind of observability work matters because analytics errors don't stay isolated. They affect channel attribution, revenue trust, QA workload, and ultimately budget allocation. When leadership loses trust in the inputs, every profitability conversation slows down.
Reliable profitability analysis starts long before the finance review. It starts where data is collected, classified, and monitored.
What actually works in practice
The teams that improve return on sales consistently usually follow a simple operating rhythm:
| Practice | Why it helps |
|---|---|
| Reconcile analytics revenue with finance regularly | Exposes definition gaps before they affect strategy |
| Review channel performance with margin awareness | Prevents scaling sales that are expensive to support |
| Monitor implementation changes continuously | Catches data breakage before reporting drifts |
| Standardize campaign and transaction naming | Makes comparisons stable across periods |
| Investigate anomalies quickly | Reduces the half-life of bad decisions |
What doesn't work is treating profitability as a quarterly finance topic while growth teams optimize on disconnected metrics every day. Return on sales improves when measurement, operations, and commercial execution are managed as one system.
Conclusion From Metric to Strategic Momentum
A leadership team can celebrate strong sales growth in the monthly review and still miss the more important signal. If the cost to generate and support those sales keeps rising, or if the sales data itself is incomplete, return on sales will look healthier or worse than the business really is.
That is why ROS matters outside finance. It gives marketing, growth, analytics, and operations a shared way to test whether revenue quality is improving along with volume. A channel that drives conversions but brings heavy returns, discounting pressure, or service costs can hurt the business even when dashboard performance looks strong.
The metric is only as trustworthy as the commercial data behind it. In practice, that is the point where many teams get misled. Net sales may be defined differently across finance and analytics. Returns may land late or outside the reporting flow. Attribution may shift because tracking broke after a release. Teams then optimize against noise and call it strategy.
The teams that use ROS well tend to do three things consistently:
- Set shared definitions for sales, operating profit, returns, and channel credit
- Maintain dependable inputs across analytics, finance, and implementation
- Correct reporting drift quickly before bad data shapes budget decisions
With that foundation, ROS becomes more than a finance ratio. It becomes a practical decision filter for pricing, channel mix, acquisition efficiency, and operating discipline. It helps teams separate profitable growth from expensive growth, which is usually the distinction that matters most.
Clean commercial data is the first step. For teams that want to automate that work and build more trust in revenue, attribution, and implementation data behind metrics like return on sales, Trackingplan helps monitor data quality across web, app, and server-side setups so marketers, analysts, and developers can work from numbers they trust.