
Your team probably has the same pattern right now. Paid media is live, lifecycle campaigns are running, product analytics is collecting events, and every stakeholder has a dashboard they trust until something looks off. Then the Slack thread starts. Is the conversion dip real, or is tracking broken again? Did a campaign underperform, or did a landing page ship with the wrong UTM logic? Are analysts slow, or are they spending half their week proving that the data can be used at all?
That tension is why Agentic BI matters.
The promise isn't just faster dashboarding. It's a different operating model for analytics. Instead of waiting for someone to notice a metric move, open a report, write a query, validate definitions, and then message the team, Agentic BI pushes toward systems that can monitor, investigate, explain, and route action with much less manual effort. For teams buried in reporting requests, that sounds like relief.
It is. But only when the data underneath it is governed well enough to deserve that autonomy.
Beyond the Dashboard Why BI Needs a Reboot
A typical marketing review looks efficient from the outside. Someone opens Looker, GA4, or a warehouse dashboard. Paid search is down. CRM conversions look flat. Product signup volume seems healthy, but the attribution split changed overnight. Every chart is technically available, yet nobody leaves the meeting with confidence.
That's the core problem with traditional BI. It gives teams access to information, but it still expects humans to do most of the hard work. Someone has to ask the right question, know where the right table lives, test whether the metric definition changed, and decide whether the movement is operational noise or a business issue.
Dashboard fatigue is operational drag
Analysts feel it first, but marketers feel it too.
- The analyst bottleneck: Teams queue requests because only a few people know the logic behind revenue, attribution, retention, or funnel definitions.
- The context gap: A dashboard can show a drop. It usually can't explain whether the drop came from campaign mix, broken tracking, audience changes, or backend issues.
- The action delay: Even when the insight is clear, it often reaches the decision-maker too late to prevent wasted spend or missed revenue.
That's why so many teams are now exploring automation beyond reporting. Some start with AI-powered dashboard creation, which can reduce the manual burden of building and organizing views. Useful, yes. But it still sits inside the dashboard model. The team is still pulling information after the fact.
A reporting stack becomes fragile when the business moves faster than the questions people have time to ask.
What changes with Agentic BI
Agentic BI reframes analytics as an active system rather than a passive interface. Instead of waiting for someone to request analysis, agents can watch for anomalies, investigate likely causes, summarize what changed, and send the result to the people who can act.
That matters because the friction isn't only in visualization. It's in the sequence between signal, interpretation, and response. Modern teams don't need more charts. They need fewer dead zones between “something changed” and “someone knows what to do next.”
What Is Agentic BI and How Is It Different
A performance lead sees paid conversions drop at 9:15 a.m. In a traditional BI setup, the next step is usually manual. Someone opens dashboards, checks attribution logic, compares campaign changes, and asks an analyst whether the drop is real or a tracking issue. Agentic BI changes that flow by assigning part of the investigation to software that can monitor signals, run follow-up analysis, and return a reasoned summary fast enough to affect the day's decisions.
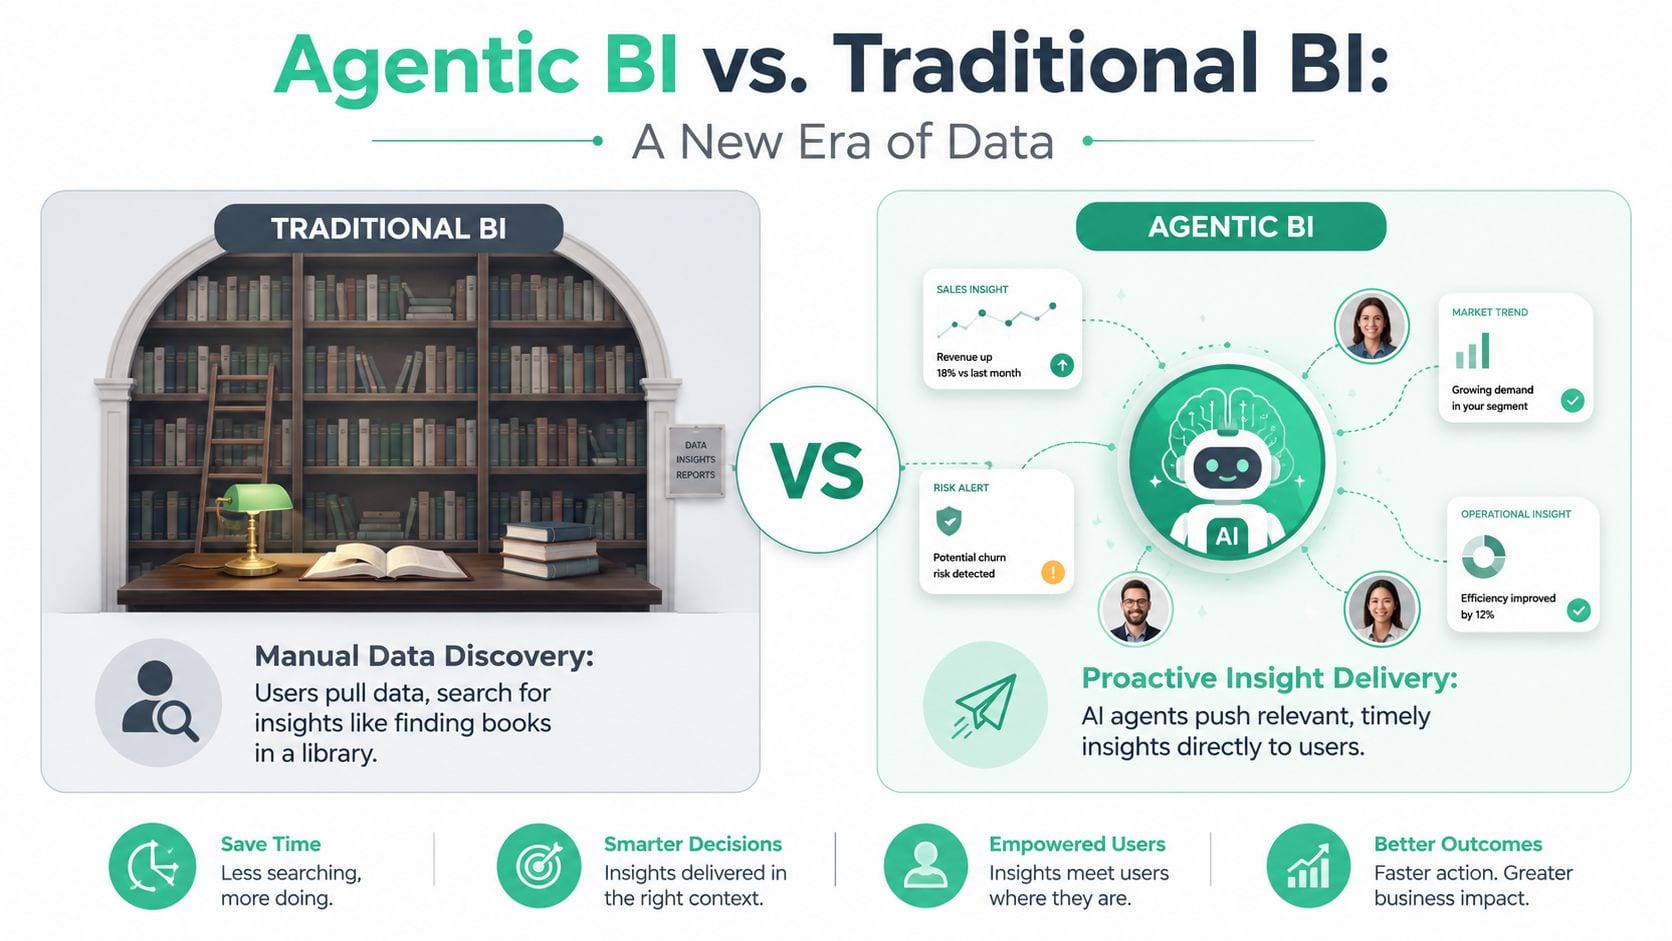
At a practical level, Agentic BI is a BI system that does more than answer a query. It observes data continuously, interprets changes against business context, and can trigger the next analytical step without waiting for a human prompt. The goal is not faster dashboarding. The goal is reducing the time between change, explanation, and action.
That distinction matters because many teams confuse agentic BI with a chat interface on top of reports. A chat layer can help users ask for a chart in plain English. Agentic BI goes further. It can detect an anomaly, test likely causes, check whether the issue is isolated or systemic, and route a conclusion to the people who need to act. Trackingplan's explanation of agentic analytics systems captures that shift well.
The defining difference
The primary difference is operating model.
Traditional BI is request-driven. A person notices a problem or has a question, then asks the system for output. Agentic BI is event-driven and policy-aware. It watches for changes, follows investigation logic, and works within defined metrics, permissions, and business rules.
That last part is where many summaries get too optimistic. Agentic BI only improves decision-making when the agent is working from governed definitions it can trust. If revenue, attribution, CAC, or retention are disputed across teams, the agent will scale confusion faster than a dashboard ever could.
Comparison table
| Characteristic | Traditional BI | Agentic BI | Autonomous AI Agent (General) |
|---|---|---|---|
| Primary mode | Reactive reporting | Proactive analysis and orchestration | Broad task automation |
| User interaction | Human asks, tool responds | System monitors, investigates, and surfaces insights | Human assigns tasks across mixed domains |
| Data context | Usually tied to dashboards and manual exploration | Tied to governed business metrics and analytics workflows | Often broad, but not inherently analytics-specific |
| Output | Charts, filters, scheduled reports | Explanations, anomaly detection, recommendations, routed actions | Text, workflows, or task execution |
| Trust model | Depends on analyst interpretation and source quality | Depends on governed definitions, permissions, and monitoring of data reliability | Depends on prompts, tools, and guardrails |
| Best use | Reporting known questions | Investigating changes and accelerating decisions | General-purpose assistance |
What Agentic BI is not
Agentic BI is not a generic AI agent pointed at a warehouse. General-purpose agents can plan tasks and call tools, but they do not automatically understand metric lineage, approved dimensions, reporting grain, or which tables are safe to use. Teams evaluating broader automation tools can discover AI agents, but analytics requires narrower controls and stronger semantic discipline than most horizontal agent frameworks provide out of the box.
It also should not be treated as a replacement for analysts. In strong implementations, agents handle monitoring, triage, first-pass analysis, and summarization. Analysts still define metrics, review edge cases, refine logic, and decide where automation is safe.
A useful test is simple. If the system can explain a metric but cannot show the governed definition behind that metric, confidence should drop immediately. In agentic BI, trust comes from verified inputs, stable business logic, and visible guardrails. Without that foundation, autonomy becomes a risk, not an advantage.
The Core Architecture and Capabilities of Agentic BI
An analyst sees a revenue dip at 9:15 a.m. Marketing sees healthy click volume. Finance sees no billing issue. Product sees a drop in signup completions. In a standard BI stack, those teams spend hours reconciling different slices of the same problem. In an agentic BI stack, the architecture decides whether that investigation takes minutes or turns into another trust failure.
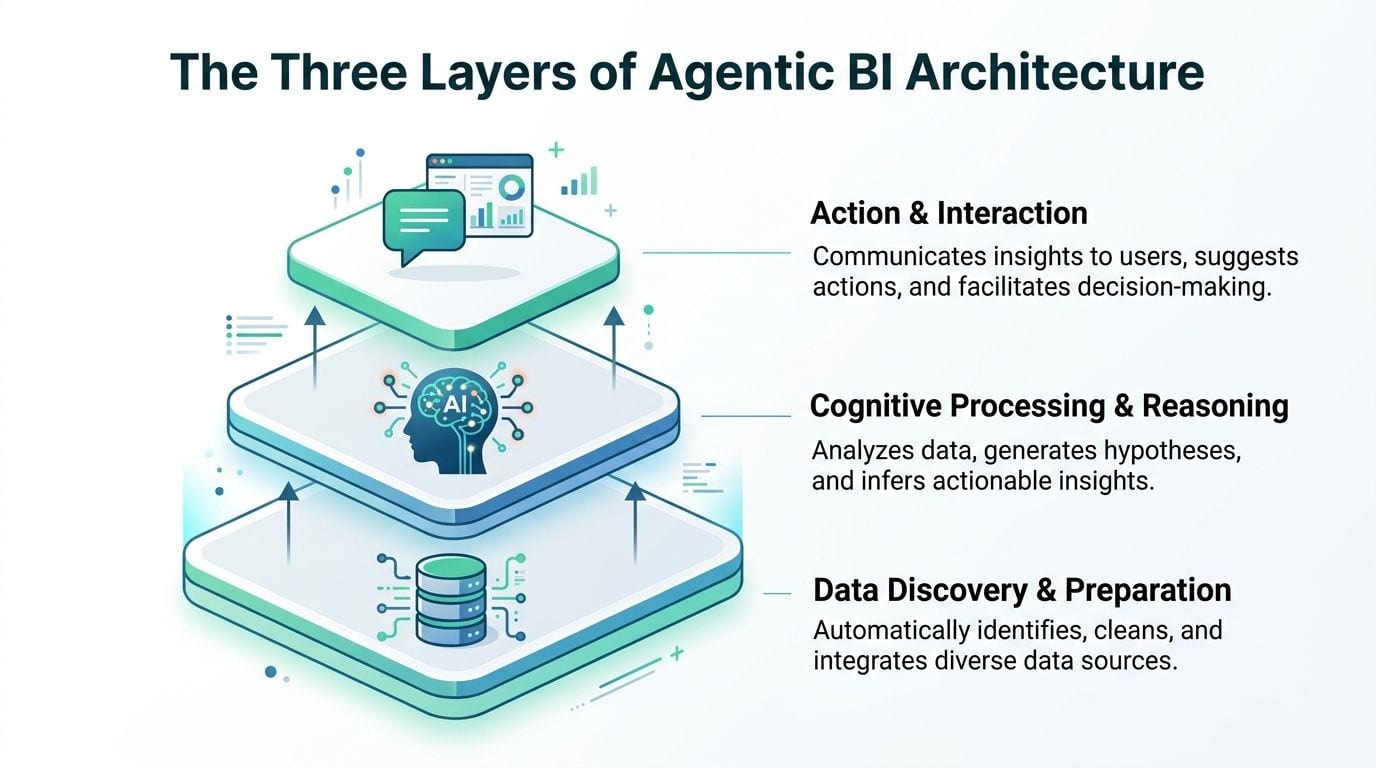
Data discovery and preparation
This layer determines whether the rest of the system is useful or dangerous.
Agentic BI needs more than raw access to tables and APIs. It needs governed metric definitions, current schema context, identity resolution, event coverage, and permission boundaries. If any of that is weak, the agent can still sound convincing while using the wrong join, the wrong grain, or an outdated field definition. That is the governance-trust paradox in practice. The more autonomous the system becomes, the less room there is for ambiguity in the data it depends on.
In operational terms, this layer usually covers:
- Source discovery: Finding data across analytics tools, ad platforms, CRM systems, finance systems, and warehouse tables.
- Preparation: Standardizing fields, resolving naming conflicts, and connecting events to customers, sessions, campaigns, or orders.
- Semantic alignment: Mapping outputs to approved metrics, reporting rules, and business logic.
- Access control: Restricting what the agent can query, summarize, or route based on role and data sensitivity.
Teams assessing architecture patterns can look at how purpose-built systems discover AI agents and assign narrow responsibilities. The same design principle works well in analytics. Specialized agents with controlled scope are easier to evaluate, monitor, and trust than one general agent with broad access.
Cognitive processing and reasoning
Once the data layer is reliable, the system can do more than retrieve numbers. It can investigate.
This layer handles the chain of work analysts usually perform by hand. It interprets a prompt or trigger, selects the right data source, compares time periods or segments, tests plausible explanations, and produces a summary that another person can review quickly. Good systems also preserve evidence. They show the metric definition used, the query path taken, and the assumptions behind the conclusion.
That matters because analytics work is rarely a single query. A meaningful answer often requires several steps. Detect the anomaly. Check whether it is isolated or broad. Compare impacted segments. Rule out known tracking issues. Separate a business change from a measurement failure.
A useful reference point is the architecture described in this overview of an agentic analytics platform, where monitoring, reasoning, and validation operate as one coordinated system instead of separate tools stitched together after the fact.
Action and interaction
The final layer turns analysis into a controlled response.
A mature agentic BI setup does not just surface a chart in another dashboard tab. It sends the issue to the right team, explains why the issue matters, and supports the next step inside the workflow people already use. That can mean routing a campaign tracking failure to marketing ops, creating a task for engineering to verify an event payload, or sending finance a note that a revenue shift appears to be a reporting artifact rather than a real commercial change.
Typical capabilities include:
- Routing alerts: Sending issues to marketing, product, finance, or engineering with the relevant context attached.
- Decision support: Suggesting checks, thresholds, or follow-up analyses based on the type of anomaly.
- Workflow handoff: Opening tasks, drafting summaries, or preparing reports for human review and approval.
- Feedback capture: Recording whether the alert was correct, ignored, or escalated so the system improves over time.
The trade-off is straightforward. The more directly an agent can trigger action, the stronger the review controls need to be. High autonomy without QA creates fast mistakes. High governance with no operational handoff creates slow insight. Strong agentic BI balances both.
Real-World Use Cases for Analytics and Marketing
The clearest agentic BI wins show up where teams currently lose time, money, and trust.
Marketing teams catching wasted spend earlier
A paid media team launches campaigns across Google Ads, Meta, and affiliate channels. By noon, conversion rate drops for one traffic segment. In a typical setup, the issue sits unnoticed until someone checks a dashboard, traces UTMs, reviews landing pages, and asks engineering whether tracking broke upstream.
Agentic BI shortens that loop. It can detect the drop, isolate the affected audience, compare it with similar campaigns, and propose a likely explanation. In practice, that often means finding a broken event on a landing page, a malformed campaign parameter, or a missing destination sync before the team burns another day of budget.
That is the practical value. Speed matters, but governed diagnosis matters more. If the system flags the wrong cause because campaign naming is inconsistent or event schemas changed without notice, the team still wastes money. Fast automation on unreliable data just produces faster confusion.
That pattern shows up clearly in agentic AI for marketing workflows, where the value comes from monitoring live processes, adding business context, and routing the issue to the team that can fix it.
Marketing teams also need to treat compliance as part of the workflow, especially when agents touch customer data, consent signals, or audience definitions. That starts with understanding GDPR legal duties before connecting autonomous systems to targeting, reporting, or activation layers.
Analytics teams reducing exploratory drag
Analysts face a different bottleneck.
A product launch goes live, and stakeholders want answers quickly. Which segments adopted first? Where does usage drop? Is the spike in engagement real, or did instrumentation change? The manual version of that work usually starts with schema checks, exploratory SQL, event validation, cohort comparisons, and a summary for stakeholders.
Agentic BI can take on the first pass. It can scan the relevant tables, surface outliers, compare cohorts, and generate a draft explanation that an analyst reviews. That saves time on repetitive setup work and leaves the analyst to do the higher-value part: checking whether the pattern is credible, whether the metric definition is stable, and whether the conclusion should drive a decision.
The trade-off is straightforward. The more teams rely on agents to accelerate analysis, the more they need confidence in tracking quality, metric definitions, and change monitoring. In real environments, the limiting factor is rarely model capability alone. It is whether the underlying analytics stack is stable enough to support autonomous reasoning without eroding trust.
For teams that want to see how tracking failures and reporting errors appear in day-to-day operations, the Trackingplan YouTube channel gives useful walkthroughs of the issues behind bad analysis.
The Governance-Trust Paradox A Critical Risk
The optimistic version of Agentic BI says this: let the system monitor everything, find insights, and trigger action faster than humans can.
That sounds efficient until the underlying data is wrong.
Autonomy multiplies both value and error
A bad dashboard is frustrating. A bad autonomous workflow is expensive. If a human analyst misreads a static report, the damage is usually limited by review, delay, and discussion. If an agent acts on broken attribution, inconsistent schemas, or dirty event streams, it can propagate that error at machine speed.
That is the Governance-Trust Paradox. The more autonomous the analytical system becomes, the more fragile trust becomes when governance is weak. The challenge is clear: while agentic BI promises autonomous action, it also amplifies the risk of bad data. With over 40% of organizations already dissatisfied with insights from static dashboards, deploying agents without effective governance can erode trust and turn a promising technology into a liability, as explained in Holistics' overview of Agentic BI.
Where teams get this wrong
The failure pattern is rarely dramatic at first. It usually starts with confidence that the AI layer will “figure it out.”
- Metric inconsistency: Different teams still define conversion, activation, or qualified lead differently.
- Schema drift: Event names or properties change, but nobody updates the semantic layer fast enough.
- Privacy and consent gaps: Sensitive fields move through the stack without clear controls.
- Approval ambiguity: Nobody has decided which actions can run automatically and which require review.
The result isn't just technical noise. It's organizational skepticism. People stop trusting the findings, then stop using the system, then conclude the AI initiative didn't work.
Governance isn't bureaucracy in this context. It's the condition that makes automation safe enough to believe.
Governance also includes legal boundaries
If Agentic BI will interpret customer behavior and potentially trigger downstream actions, privacy obligations can't be treated as a late-stage compliance check. Teams operating in regulated environments should understand consent handling, data minimization, and processing responsibilities early. A practical primer on understanding GDPR legal duties can help frame that discussion before automation expands faster than policy.
The hard truth is simple. Most Agentic BI failures won't happen because the model was weak. They'll happen because the organization automated decision support on top of messy, poorly governed analytics.
A Checklist for Implementing Agentic BI Successfully
Adoption goes better when teams treat Agentic BI as a controlled rollout, not a feature toggle.
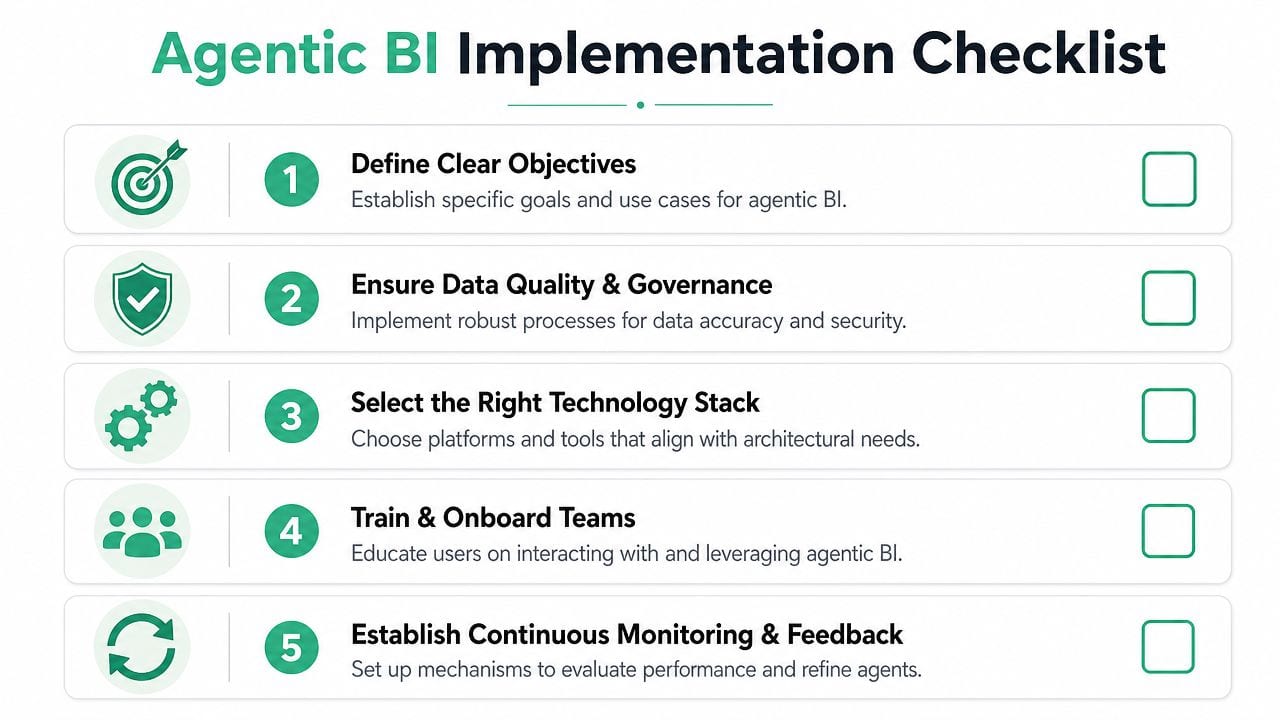
Start with the data foundation
Before comparing vendors or drafting prompts, audit the inputs.
Check measurement quality
Review tracking consistency, schema stability, naming conventions, destination mappings, and consent controls. If your event layer is unstable, Agentic BI will automate confusion.Identify governed metrics
Pick the handful of KPIs that already have accepted definitions. Don't start with vague concepts that vary by team.
Scope one business problem
The strongest pilots solve one narrow, painful workflow.
- Good starting point: Investigating conversion anomalies in paid acquisition.
- Also good: Monitoring funnel breaks in onboarding or product signup.
- Poor starting point: “Use AI to improve all analytics.”
A narrow use case gives the team something testable. It also forces clarity on thresholds, approvals, and expected outputs.
Evaluate platforms beyond the demo
Many demos look smart because they answer curated questions. Production success depends on harder criteria:
| Evaluation area | What to look for |
|---|---|
| Data trust | Traceability to governed definitions and source systems |
| Workflow design | Ability to monitor, investigate, and route outcomes |
| Human review | Clear checkpoints for approval on high-impact actions |
| Auditability | Logs, explanations, and repeatable reasoning paths |
Build guardrails before scale
This is the part teams try to postpone. Don't.
- Define approval tiers: Some insights can be auto-routed. Higher-risk actions should require review.
- Set confidence boundaries: Agents should escalate uncertainty, not hide it.
- Monitor behavior: Review what the system surfaces, what people ignore, and where explanations fail.
One useful test: If a marketer receives an automated recommendation, can they tell what data it used, which definition it relied on, and who approved the rule behind it?
Train the users, not just the model
Adoption fails when the team thinks Agentic BI is replacing judgment. It works when analysts, marketers, and operators understand where to trust it, where to challenge it, and how to feed improvements back into the system.
Ensuring Reliability with Analytics QA Platforms
Every promise around Agentic BI depends on one assumption. The data feeding the agents is reliable enough to support continuous interpretation and action.
That assumption breaks more often than teams acknowledge.
Why observability matters before autonomy
An analytics observability and QA layer acts like a control system for the data environment. It watches the implementation itself, not just the business output. That means broken pixels, schema mismatches, campaign tagging issues, and destination failures can be caught before they contaminate reports, models, and automated workflows.
Trackingplan's published product materials describe a particularly relevant model for this kind of foundation. The platform learns a company's measurement plan directly from real user traffic and automatically discovers and models data sent to third parties like Google Analytics, 24/7. It also sends instant alerts through Slack, email, or Microsoft Teams when an anomaly appears, helping teams fix issues within minutes, as described in Trackingplan's analytics platform feature guide.
That kind of continuous QA is exactly what Agentic BI needs underneath it.
What this changes in practice
Instead of asking analysts to discover tracking problems after dashboards drift, teams can monitor the instrumentation layer continuously. That changes the risk profile of automation.
- Higher trust in inputs: Agents work from cleaner, more stable data.
- Faster issue containment: Teams catch instrumentation failures before they spread into multiple reports or actions.
- Better governance posture: Monitoring helps enforce what should be collected, where it should go, and whether the implementation matches policy.
For teams comparing this category, a useful starting point is this guide to best data integrity platforms in 2026, especially when the goal is to support analytics reliability rather than just dashboard maintenance.
The practical conclusion is simple. Agentic BI is not just an AI project. It's a data trust project. If the trust layer is weak, the autonomy layer becomes a liability.
If your team wants Agentic BI to deliver useful automation instead of fast confusion, start with the data layer first. Trackingplan helps teams monitor analytics quality, detect implementation issues in real time, and build the trust foundation that autonomous analytics depends on.