Learn to effectively monitor website pixels workflow to prevent costly campaign errors. Discover essential tools and troubleshooting tips!
TL;DR:
- Building a robust pixel monitoring workflow helps detect failures early, preventing data loss and attribution errors.
- Using a combination of client-side tools, server validations, and visual checks ensures comprehensive pixel health verification across your site.
Pixels break quietly. No error message appears in your dashboard, no alert fires, and your campaigns keep spending. You only discover the problem days later when conversion numbers look wrong and attribution data is a mess. Building a solid monitor website pixels workflow is how you catch these failures before they cost you real money. This guide walks you through every stage: the tools you need, a step-by-step verification process, visual monitoring techniques, and how to troubleshoot the issues that derail even well-built implementations.
Table of Contents
- Key takeaways
- Monitor website pixels workflow: tools and prerequisites
- Step-by-step workflow to verify pixel firing
- Using visual monitoring to catch pixel-breaking changes
- Troubleshooting common pitfalls and optimizing your workflow
- My take on where pixel monitoring actually breaks down
- How Trackingplan simplifies pixel monitoring at scale
- FAQ
Key takeaways
| Point | Details |
|---|---|
| Start with the right tools | Combine GTM Preview Mode, network analyzers, and consent management platforms before you write a single test. |
| Validate both client and server | Test browser-side pixel events and Conversions API events together to catch deduplication failures early. |
| Use visual monitoring alongside network checks | Screenshot diffing catches UI changes that break pixel triggers, a gap that network tools cannot fill. |
| Treat alerts as a science | Calibrate thresholds carefully so alerts flag real problems without creating noise that teams learn to ignore. |
| Embed monitoring in your dev cycle | Schedule recurring pixel audits and tie them to deployment cycles, not just incident responses. |
Monitor website pixels workflow: tools and prerequisites
Before you run a single test, you need the right stack in place. Skipping this step is how teams end up debugging blind, spending hours on symptoms instead of root causes.
Browser-side tools
Google Tag Manager Preview Mode lets you validate in real time which tags fired, which triggers activated, and what values your variables held during any given event. It’s the single fastest way to confirm whether a pixel even attempted to fire before you look anywhere else. Pair it with browser extensions built for pixel auditing, like Meta Pixel Helper or the Google Tag Assistant, to get a pixel-level view of what’s actually reaching ad platforms.
A network analyzer, such as your browser’s built-in developer tools or Charles Proxy, gives you the raw request and response data. You can see the exact payload being sent, which query parameters are populated, and whether the response code indicates a successful delivery. This layer catches issues that tag management tools sometimes abstract away.
Server-side and consent tools
If you’re running a server-side setup, you need tools specific to that environment. Server-side GTM requires routing events through Preview Mode using specific request headers so you can validate event forwarding without sending polluted data to your production analytics. This matters because mapping errors and tag firing errors look different at the server level, and you need to be able to separate them.

Consent Management Platform (CMP) integration is non-negotiable for any pixel implementation operating in privacy-regulated markets. CMP workflows automate the scanning and blocking of trackers until a user opts in, and they run ongoing scans to detect any new undesired trackers that appear on your pages. Without this layer, you may be monitoring pixels that are already blocked for a significant portion of your audience without knowing it.
Pro Tip: Before building any monitoring workflow, map out which pixels exist on each page, what consent category each belongs to, and what the expected behavior is under different consent states. This baseline document becomes your reference for every future audit.
Quick-reference tool comparison
| Tool category | Primary use | Limitation |
|---|---|---|
| GTM Preview Mode | Tag and trigger validation | Client-side only by default |
| Browser dev tools | Raw network request inspection | Requires manual effort per session |
| Meta Test Events | Platform-level event verification | Platform-specific, not cross-channel |
| CMP scanner | Consent compliance monitoring | Does not validate data accuracy |
| Screenshot diff tools | Visual change detection | Cannot detect network-level failures |
Step-by-step workflow to verify pixel firing
With your tools ready, the actual verification process follows a logical sequence. Rushing any of these steps creates gaps that will surface at the worst possible time.
-
Open GTM in Preview Mode before touching anything else. Connect to the page you’re testing and perform the user action that should trigger your pixel. GTM’s preview panel will show you every tag that fired, every tag that didn’t, and the exact trigger condition that was evaluated. Checking data layer and triggers first is consistently faster than making random edits to tag code.
-
Inspect the data layer for the correct values. Most GTM tracking failures originate from missing or incorrect data layer values, not the tag itself. Open the Variables tab in Preview Mode and verify that every variable your pixel depends on, such as event name, currency, value, and order ID, contains the expected data at the right moment.
-
Validate the browser-side pixel event in the platform’s native tool. For Meta, open the Events Manager and use the Test Events feature. Enter your pixel ID, perform the conversion action on your site, and watch the incoming events in real time. Confirm that the event name, parameters, and custom data fields all arrive as expected.
-
Test your Conversions API event in parallel. Server-side events should fire for the same user action. Verify that your server event carries a matching "event_id` value to the browser event. Deduplication requires matching event_id values sent within 48 hours from both the client and server sides. If the IDs don’t match, Meta will count both events as separate conversions.
-
Check event parameters for completeness. Review
event_time,user_datafields like email hash and phone hash, and any custom parameters your campaigns rely on. A pixel that fires but sends incomplete data is nearly as problematic as one that doesn’t fire at all, because partial data degrades your Event Match Quality score and weakens attribution. -
Document every result before making any changes. Screenshot the Preview Mode panel, save the Test Events log, and note the exact data layer state. This creates an evidence baseline you can compare against after any future site update.
Pro Tip: Run your full verification sequence in an incognito window with your CMP set to “accept all” consent, and then repeat the same sequence with consent declined. Comparing the two results immediately shows you which pixels are correctly gated by consent.
Using visual monitoring to catch pixel-breaking changes
Network-level checks confirm whether a pixel is firing. Visual monitoring answers a different and equally critical question: has something changed on the page that would prevent the pixel from firing next time?
A UI change that removes a button, renames a CSS class, or alters the DOM structure of a checkout form can break a trigger without touching a single line of tag code. Visual monitoring via scheduled screenshots and automated pixel-diff alerts catches these changes before they silently corrupt your data.
The mechanics work like this. You capture a screenshot of a key page or component on a schedule (hourly, daily, or triggered by deployment). A diffing algorithm compares the new screenshot to your stored baseline and generates a percentage change score. The key is threshold calibration:
- Under 1% difference typically reflects dynamic content like personalized text or rotating banners. This is noise, not signal.
- 5% to 20% difference indicates a meaningful layout or content change that warrants investigation. A button may have moved, a form section may have been restructured, or a tracking container may have shifted.
- Over 20% difference signals an immediate issue. Pages that change this dramatically usually have a deployment problem, a CMS error, or a major template change that almost certainly broke something in your tracking setup.
Connecting this system to Slack or email alerts means your team gets notified within minutes of a critical change, not hours or days later when ad performance data starts degrading.
Pro Tip: Maintain a versioned screenshot archive and update your baseline intentionally, only after investigating a flagged change and confirming your pixels still work correctly. Blindly accepting a new baseline without verification defeats the purpose entirely.
It’s worth being clear that visual monitoring complements network monitoring rather than replacing it. Dynamic content variability means you will get some false positives, and threshold tuning is an ongoing task, not a one-time setup. Use visual monitoring to catch what network tools miss, not as a substitute for them.
| Change level | Diff percentage | Recommended response |
|---|---|---|
| Likely dynamic content | Below 1% | No action required |
| Investigate promptly | 5% to 20% | Review page and verify pixel behavior |
| Immediate alert | Above 20% | Escalate and test all pixels on affected pages |
Troubleshooting common pitfalls and optimizing your workflow
Even well-structured monitoring setups run into recurring problems. Recognizing these patterns saves hours of troubleshooting.
![]()
Misconfigured triggers or data layer variables. This is the most frequent source of pixel failures. A developer renames a CSS class, a variable name changes slightly in the data layer, or a new page template doesn’t include the push event that triggers your tag. These issues are invisible until you open Preview Mode and see the trigger simply wasn’t evaluated. Build a habit of re-validating trigger conditions after every significant site deployment.
Deduplication failures between client and server events. When your browser pixel and your Conversions API both fire for the same event but carry different or missing event_id values, you end up with double-counted conversions. This inflates your reported ROAS and corrupts your budget optimization signals. Audit your deduplication logic whenever you update either the browser pixel or the server-side implementation.
Consent-related pixel blocking. A pixel that works perfectly in your pre-consent test session may be blocked for 40% of your real visitors. Integrating your consent management workflows into your monitoring process means testing pixel behavior under each consent state, not just the “all accepted” scenario. This is especially relevant in markets covered by GDPR and CCPA.
Alert fatigue from poorly calibrated thresholds. Monitoring tools that fire alerts for every minor fluctuation train your team to ignore them. Set your alert thresholds based on meaningful degradation. For Event Match Quality, triggering alerts on a drop of more than 1.5 points or below a critical threshold keeps your team responsive without generating constant noise.
Token and credential expiration. Server-side integrations using API tokens, access keys, or OAuth credentials will silently fail when those credentials expire. Automate token refresh where possible, and build calendar reminders for manual renewals. A pixel that worked last month and fails today because a token expired is an embarrassing and avoidable data loss.
A well-optimized pixel monitoring workflow also builds redundancy. For any pixel tied to significant ad spend, maintain a secondary verification method. If your primary check is GTM Preview Mode, your secondary check might be a platform-level audit. For data quality monitoring at scale, tools like Trackingplan provide automated pixel health checks that run continuously without requiring manual sessions.
My take on where pixel monitoring actually breaks down
I’ve worked with enough analytics implementations to say this plainly: the majority of pixel problems are not technical failures. They’re process failures. The tag is often fine. The pixel fires. The issue is that nobody built a system to check whether it was still firing correctly after the last five site updates.
What I’ve found is that teams invest heavily in the initial implementation and almost nothing in ongoing verification. A pixel that passed QA in January is trusted through December, even as the site changes around it. By the time someone notices the data is wrong, the damage is weeks deep.
Visual monitoring filled a real gap in my own thinking. I used to rely entirely on network-level checks, and I kept getting surprised by trigger failures caused by DOM changes I didn’t know had happened. UI changes that break pixel triggers are entirely invisible to network monitoring. The screenshot diffing approach felt lightweight at first, but it’s caught more real issues than I expected.
The server-side conversation is also shifting. Proper deduplication is not a nice-to-have. It directly affects your reported attribution, your smart bidding signals, and your budget allocation. I’ve seen campaigns optimize toward ghost conversions for weeks because the deduplication logic broke silently. That’s budget you cannot recover.
My practical advice: schedule a pixel review the same way you schedule a sprint. Put it on the calendar, assign an owner, and treat a green audit as a deliverable. Don’t wait for bad data to tell you something is wrong. For a structured approach to that audit, the pixel implementation audit playbook from Trackingplan is worth bookmarking.
— David
How Trackingplan simplifies pixel monitoring at scale
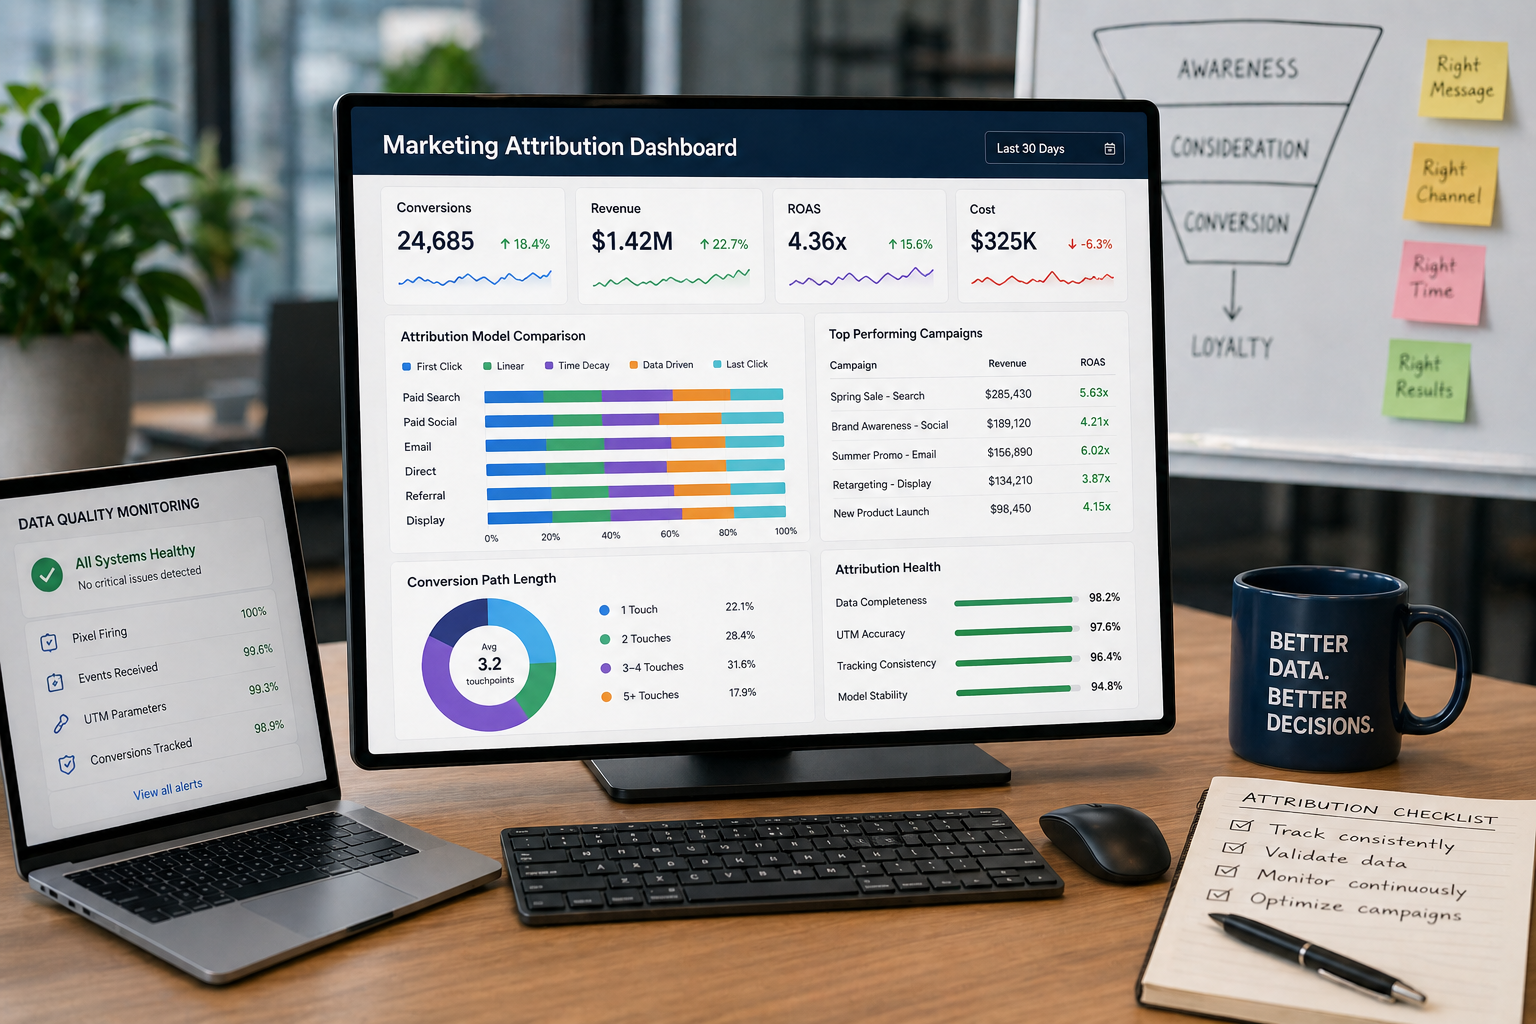
Managing pixel health across multiple pages, platforms, and consent states manually is unsustainable as your site grows. Trackingplan automates the detection of broken pixels, missing events, schema mismatches, and consent violations across your entire Martech stack.
![]()
Instead of running manual GTM sessions after every deployment, Trackingplan monitors your digital analytics implementation continuously and sends real-time alerts via Slack, email, or Teams the moment something breaks. The platform also surfaces root-cause analysis so your team spends time fixing problems, not hunting for them. If you want to see exactly how the monitoring works in practice, the platform overview walks through the full detection and alerting workflow. Accurate data means better attribution, smarter bids, and marketing decisions you can actually trust.
FAQ
What is a pixel monitoring workflow?
A pixel monitoring workflow is a structured process for verifying that tracking pixels fire correctly, send accurate data, and behave as expected under different consent states and site conditions. It combines tools, scheduled checks, and alert systems to catch failures before they damage your marketing data.
How do I monitor both client-side and server-side pixel events?
Use GTM Preview Mode to validate client-side tag firing and data layer values, then use platform-specific tools like Meta’s Test Events to confirm server-side Conversions API events are received. Verify that both events share a matching event_id to prevent duplicate conversion counting.
Why do pixels stop firing after a site update?
Most post-update pixel failures trace back to changed trigger conditions, renamed CSS classes, or data layer variables that were modified or removed during development. Running GTM Preview Mode immediately after any deployment catches these issues before they affect live data.
What role does visual monitoring play in pixel tracking?
Visual monitoring detects page layout and UI changes that can break pixel triggers indirectly. A button removed or a form restructured will not appear in a network log, but a screenshot diff will flag it. It works alongside network monitoring to give a fuller picture of what’s happening on your pages.
How do I reduce false alerts in my pixel monitoring setup?
Calibrate your alert thresholds based on meaningful change levels. For visual monitoring, ignore diffs below 1% and investigate anything above 5%. For Event Match Quality, set alerts only when scores drop by more than 1.5 points or fall below a defined critical floor, keeping alerts specific to genuine degradation.