Master the art of identifying data issues with our detecting data anomalies guide. Improve accuracy and save on wasted ad spend today!
TL;DR:
- Effective anomaly detection in marketing data combines rule-based checks, statistical methods, and machine learning in layered systems to prevent false alarms. Using granular, time-based baselines and shadow deployment practices ensures alerts are trustworthy and actionable. Prioritizing data hygiene over complex algorithms leads to faster, more reliable results.
A data anomaly is any value, pattern, or structural change in your dataset that deviates from expected behavior, and detecting it early is the difference between accurate attribution and wasted ad spend. This detecting data anomalies guide covers the full stack: from schema drift and volume spikes to statistical scoring with STL decomposition and Welford’s algorithm, through to machine learning models like isolation forests. Tools like Databricks Unity Catalog have made freshness detection adaptive rather than fixed, and platforms like Trackingplan bring real-time alerting to marketing analytics teams who cannot afford to wait for a weekly data review to catch a broken pixel.
What are the main types of data anomalies in marketing analytics?
Anomaly detection categories for data pipelines fall into four distinct types: schema drift, freshness failures, volume anomalies, and statistical value outliers. Each type requires a different detection check, and each one can silently corrupt your campaign reporting before anyone notices.
Schema drift occurs when a field name changes, a data type shifts, or a new column appears without warning. In marketing data, this often happens when a third-party tag fires a renamed property or when a CRM export changes its column headers. The result is broken joins, null attribution, and conversion counts that quietly drop to zero.
Freshness failures mean your data stopped updating on schedule. A table that should refresh every hour but sits stale for six hours will make your dashboards show flat lines during a live campaign. Databricks Unity Catalog handles this by modeling expected commit times and marking tables unhealthy when commits arrive unusually late, using learned thresholds rather than fixed clock times.
Volume anomalies are row-count deviations from a learned baseline. A sudden 40% drop in event volume on a Tuesday morning could mean a tracking script failed, or it could simply be normal weekend decay bleeding into early-week numbers. The distinction matters enormously for triage.
Statistical value outliers are individual data points that fall far outside the normal distribution for a given metric. Common examples in digital marketing include:
- A single session generating 10,000 pageviews (bot traffic or a tracking loop)
- A cost-per-click value of $0.00 (missing bid data or a broken API response)
- Conversion rates above 100% (duplicate event firing or misconfigured deduplication)
- Revenue figures with negative values (refund events tagged as purchases)
Volume anomalies in marketing require granular baselines at the campaign, platform, and day-of-week level. Comparing Monday traffic to the prior Monday is far more accurate than comparing it to a 30-day rolling average that smooths over weekly cycles.
How to implement layered anomaly detection methods
The most effective approach to spotting data anomalies combines three layers: deterministic rule checks, statistical detectors, and machine learning scoring. A layered system catches what single-method approaches miss, balances false positives, and gives analysts explainable signals at every tier.
-
Layer 1: Rule-based deterministic checks. Write explicit tests for impossible values. A session duration below zero, a null campaign ID on a paid click, or a duplicate transaction ID are all hard failures. These checks run fast, produce zero ambiguity, and should block data from entering your reporting layer entirely.
-
Layer 2: Statistical detectors. Apply z-scores, robust z-scores, or STL decomposition to flag explainable deviations. STL decomposition separates a time series into seasonal, trend, and remainder components. Anomalies are then flagged on extreme residual values after seasonal and trend effects are removed. This is far more accurate than flagging raw spikes, which often reflect normal calendar patterns rather than actual errors.
-
Layer 3: ML-based scoring. Use models like isolation forests or Facebook’s Prophet to rank subtle, nonlinear anomalies that rules and statistics miss. These models excel at detecting gradual drift, correlated multi-metric shifts, and patterns that have no simple threshold definition.
Pro Tip: Start with statistical tests before deploying ML. ML adds operational complexity and interpretability challenges that are hard to justify until your rule and statistical layers are stable and trusted.
The layering logic is deliberate. Rules catch the obvious. Statistics explain the explainable. ML catches the unknown unknowns that neither rules nor z-scores would ever surface. Each layer feeds context to the next, and the combined signal is far more trustworthy than any single method alone.

Which tools and algorithms work best for marketing data pipelines?
Choosing the right tool depends on your pipeline complexity, team skill set, and how much operational overhead you can absorb. The table below maps common methods to their practical fit.
| Method | Best for | Complexity | Key limitation |
|---|---|---|---|
| Rule-based checks (dbt tests) | Schema drift, nulls, duplicates | Low | Misses unknown patterns |
| Welford’s algorithm | Running mean and variance at scale | Low | Assumes near-normal distributions |
| Robust z-scores | Value outliers with skewed data | Medium | Requires sufficient history |
| STL decomposition | Seasonal time-series anomalies | Medium | Needs at least 2 full seasonal cycles |
| Prophet | Trend and holiday-aware forecasting | Medium | Slower to retrain on large datasets |
| Isolation forest | Subtle multivariate anomalies | High | Low interpretability |
| Databricks Unity Catalog | Freshness detection at warehouse scale | Medium | Platform-specific |
Welford’s algorithm deserves more attention than it typically gets in marketing analytics. It computes running mean and variance in a single pass without storing the full dataset. For high-volume event streams where recalculating from scratch is expensive, Welford’s gives you a continuously updated statistical baseline with minimal memory cost.
For schema drift detection, metadata diffs against a known-good schema snapshot are the most reliable approach. Track field names, data types, and cardinality. When any of those change without a corresponding deployment record, flag it immediately.
Pro Tip: For seasonality-aware detection in marketing data, STL decomposition residuals produce more meaningful anomaly signals than raw metric spikes. STL residuals remove the noise of normal calendar effects before you assess whether something is truly wrong.
A hybrid approach works best for most marketing teams: dbt-native tests for schema and volume, robust z-scores for value outliers, and Prophet or STL for time-series metrics like daily sessions, conversions, or revenue. Add an isolation forest only when you have enough labeled anomaly history to validate its output.
How do you reduce false positives and keep alerts trustworthy?
Alert fatigue is the silent killer of anomaly detection programs. When analysts learn to ignore alerts because most of them are noise, the entire detection system loses its value. Noisy alerting is almost always caused by poor tuning and ignoring calendar effects, not by having too many checks.
The fixes are operational, not algorithmic:
- Model calendar effects explicitly. Black Friday, end-of-quarter pushes, and weekend traffic drops are not anomalies. Build these patterns into your baselines so your detectors do not fire on expected behavior.
- Tie alerts to service-level objectives (SLOs). An alert should represent a breach of a business commitment, not just a statistical threshold. If a 15% drop in conversion tracking does not affect a reportable metric, it should not page anyone at 2 a.m.
- Use severity tiers. Separate critical alerts (data is completely missing) from warnings (data is slightly late) from informational notices (a metric is trending toward a threshold). Route each tier to the right channel and the right team.
- Group correlated alerts. If a single pipeline failure causes 12 downstream tables to go stale, send one grouped alert with root-cause context, not 12 separate notifications.
Operational success in anomaly detection requires explainable signals, false positive control, alert tiering, impact correlation, and shadow deployment before going live.
Shadow mode deployment is the most underused practice in this space. Run a new detector in observation mode for one to two weeks before it triggers any alerts. Log what it would have flagged, review those cases manually, and tune thresholds before analysts ever see a notification. This single practice prevents the trust erosion that kills most anomaly detection rollouts.
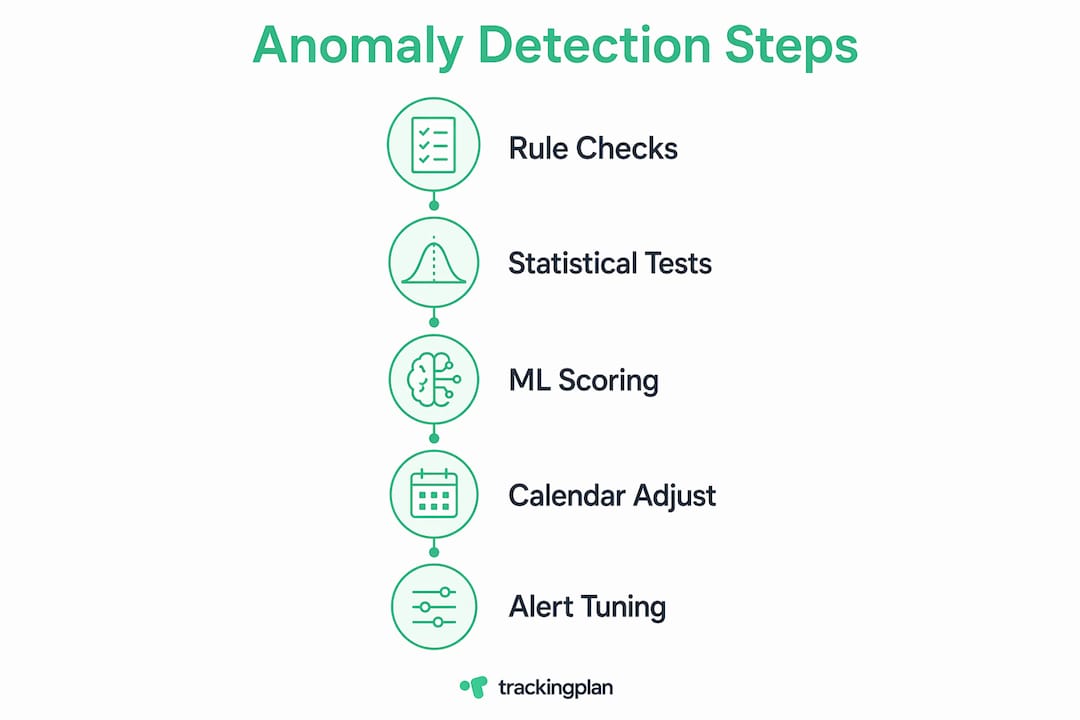
What steps should analysts follow to start spotting anomalies?
A structured workflow prevents the most common mistake: jumping straight to ML before the fundamentals are in place.
-
Audit your data quality baseline. Before you can detect anomalies, you need to know what normal looks like. Pull 90 days of historical data for each key metric and document expected ranges, update frequencies, and known seasonal patterns.
-
Implement rule-based checks first. Write tests for nulls, impossible values, duplicates, and schema consistency. These should run on every pipeline refresh. Fix any failures before moving to statistical methods.
-
Add statistical detectors for your highest-priority metrics. Apply robust z-scores to value columns and STL decomposition to time-series metrics. Set initial thresholds conservatively to minimize false positives during the learning period.
-
Deploy new detectors in shadow mode. Log alerts without sending them. Review flagged cases daily for one to two weeks. Adjust thresholds based on what you observe.
-
Activate alerts with severity tiers. Once shadow mode confirms your detector is accurate, route critical alerts to Slack or Teams, warnings to a daily digest, and informational notices to a monitoring dashboard.
-
Schedule regular tuning reviews. Anomaly baselines drift as your business grows. Review thresholds quarterly, update seasonal models after major campaigns, and retire rules that no longer reflect your data structure.
A marketing data quality audit before you start this workflow will surface the gaps that make anomaly detection unreliable. Skipping the audit means your baselines are built on already-corrupted data, and your detectors will learn the wrong version of normal.
Key Takeaways
Effective anomaly detection combines rule-based checks, statistical methods, and ML scoring in layers, with calendar-aware baselines and shadow deployment to keep alerts trusted and actionable.
| Point | Details |
|---|---|
| Layer your detection methods | Start with rules, add statistical scoring, then ML for subtle patterns. |
| Match baselines to granularity | Use campaign, platform, and day-of-week baselines for marketing data. |
| Deploy in shadow mode first | Validate new detectors for 1–2 weeks before activating alerts. |
| Tie alerts to business impact | Link thresholds to SLOs, not just statistical significance. |
| Audit before you detect | Build baselines on clean historical data, not already-corrupted records. |
What I’ve learned from watching anomaly detection fail in the field
Most anomaly detection projects fail not because the algorithms are wrong but because the operational layer is ignored. I have seen teams spend weeks tuning isolation forests while their rule-based checks were still firing on known schema changes from a deployment three months prior. The ML model was learning corrupted data as normal.
The counterintuitive truth is that anomaly detection in marketing is 80% data hygiene and 20% algorithm. A well-tuned z-score on a clean baseline will outperform a sophisticated ML model on messy data every single time. Teams that accept this and invest in the boring work first, auditing schemas, documenting update schedules, and building granular baselines, get to reliable detection faster than teams that chase the most advanced technique.
The other lesson I keep relearning is that alert trust is fragile and slow to rebuild. One week of noisy alerts can train an entire analytics team to ignore the notification channel. Shadow mode is not optional. It is the single most important operational practice in this entire workflow, and it costs nothing except patience.
Start small. Pick your three most business-critical metrics. Build clean baselines. Add one layer at a time. The teams that do this incrementally end up with detection systems that actually get used.
— David
How Trackingplan monitors your analytics for anomalies
Trackingplan automates the detection work described in this guide across your entire Martech stack, covering websites, apps, and server-side environments without requiring manual threshold configuration for every metric.
![]()
The platform monitors digital analytics tools for missing pixels, schema mismatches, volume drops, and tracking errors in real time, sending alerts via Slack, Teams, or email the moment something breaks. For teams managing multiple client sites or complex attribution setups, Trackingplan’s automated audit and root-cause analysis cuts the time from anomaly to fix from hours to minutes. If you want web tracking monitoring that works without building a detection system from scratch, Trackingplan is the direct path there.
FAQ
What is a data anomaly in analytics?
A data anomaly is any value, pattern, or structural change that deviates from expected behavior in a dataset. Common examples include schema drift, stale data, volume spikes or drops, and statistical outliers in metric values.
What are the best data anomaly detection methods for marketing data?
The most effective approach combines rule-based checks for schema and nulls, robust z-scores for value outliers, and STL decomposition or Prophet for time-series metrics. Starting with statistical tests before ML reduces operational complexity.
How do I reduce false positives in anomaly detection?
Model calendar effects and seasonality into your baselines, tie alert thresholds to business SLOs, and use shadow mode deployment to validate detectors before they send live notifications. Alert fatigue is almost always a tuning problem, not a volume problem.
What is shadow mode in anomaly detection?
Shadow mode means running a new detector in observation-only mode for one to two weeks before it triggers alerts. You log what it would have flagged, review those cases manually, and tune thresholds based on real data before analysts see any notifications.
How granular should anomaly detection baselines be for marketing data?
Baselines should match the granularity of your reporting: per campaign, per platform, and per day of week. A single 30-day rolling average will mask weekly cycles and generate false positives on normal Monday-to-Friday traffic patterns.