
TL;DR:
- Analytics involves examining data, while insights are actionable conclusions derived from that analysis. Most teams focus on outputs rather than using insights to make informed marketing decisions, risking ineffective strategies. Ensuring data quality, defining clear decisions, and fostering a culture of evidence-driven work improve analytic outcomes.
Analytics and insights are defined as the paired processes of examining data and converting findings into knowledge that drives marketing decisions. Analytics covers the collection, measurement, and analysis of data. Insights are what you extract from that analysis: the specific, contextual conclusions that tell you what to do next. Most digital marketers treat these two concepts as interchangeable, which is the first mistake. Raw numbers from a dashboard are analytics. The conclusion that your Tuesday email sends outperform Friday sends by a measurable margin is an insight. Understanding that gap changes how you work.
What are the core data analysis techniques used to generate insights?
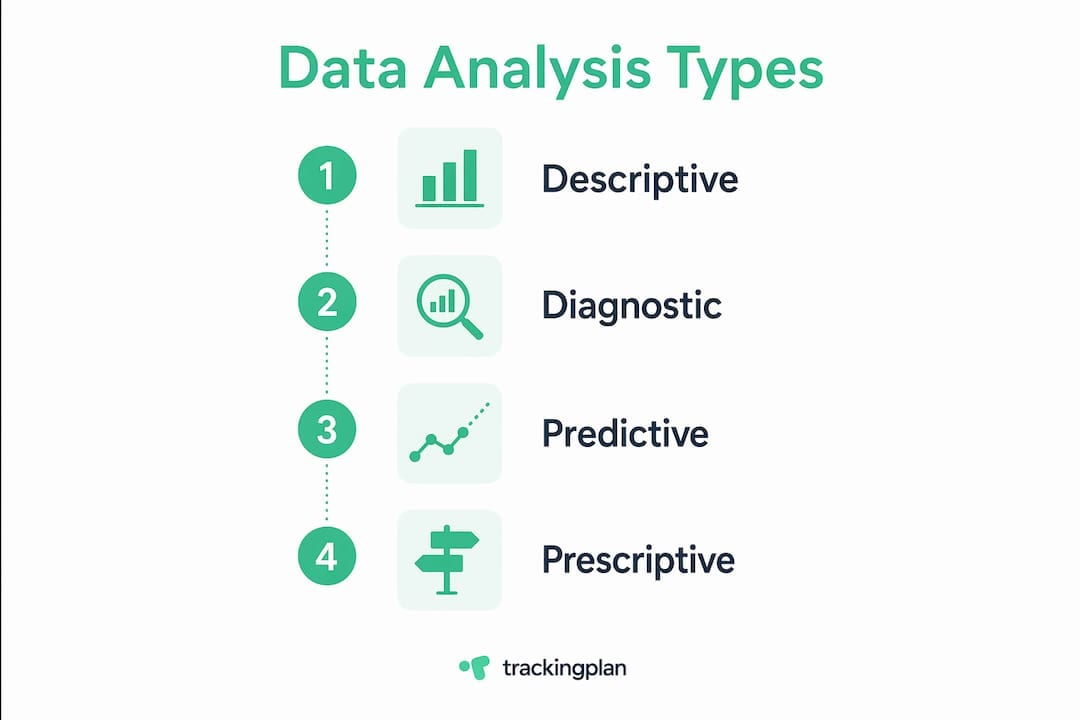
Data analysis techniques fall into four categories, and each one answers a different marketing question. Knowing which category to use before you open a dashboard saves hours of unfocused exploration.
-
Descriptive analytics answers “What happened?” It summarizes historical data through metrics like click-through rates, session counts, and revenue by channel. Most standard marketing dashboards operate at this level.
-
Diagnostic analytics answers “Why did it happen?” Techniques like cohort analysis and funnel analysis isolate the variables that explain a performance shift. If your conversion rate dropped in march, diagnostic analytics identifies whether the cause was a traffic source change, a landing page issue, or a seasonal pattern.
-
Predictive analytics answers “What will happen?” Statistical models and machine learning algorithms forecast future outcomes based on historical patterns. In paid media, predictive models estimate which audience segments are most likely to convert before you spend a dollar.
-
Prescriptive analytics answers “What should we do?” It goes beyond forecasting to recommend specific actions. Budget allocation tools that suggest shifting spend from one channel to another based on projected return operate at this level.
The four core categories form a progression. Descriptive and diagnostic analytics explain the past. Predictive and prescriptive analytics shape the future. Most marketing teams spend the majority of their time in the first two categories and underuse the latter two, which is where the largest efficiency gains live.
Beyond the four categories, digital marketers use techniques including aggregation, segmentation, and funnel analysis to transform raw transaction records into optimized marketing metrics. Segmentation alone, when applied to email lists or paid audiences, routinely surfaces performance differences that flat aggregate data hides entirely.
AI is collapsing the boundaries between these categories. Platforms now allow marketers to move from descriptive to prescriptive analysis within a single workflow, using conversational interfaces to query data without writing SQL. The semantic layer governs this process by mapping business terms to underlying data structures, which keeps AI-generated insights contextually accurate rather than statistically plausible but meaningless.
Pro Tip: Before running any analysis, write down the specific decision the output needs to inform. If the analysis cannot change your decision, you do not need it.
| Analysis type | Marketing question answered | Example application |
|---|---|---|
| Descriptive | What happened? | Monthly channel performance report |
| Diagnostic | Why did it happen? | Cohort analysis of churn after a price change |
| Predictive | What will happen? | Forecast of Q3 revenue by segment |
| Prescriptive | What should we do? | Budget reallocation recommendation by channel ROI |
How to interpret analytics to extract truly actionable insights?
Interpretation is where most analytics programs break down. The data is often fine. The reading of it is not.

Three common data traps destroy the reliability of marketing insights: false precision, confusing correlation with causation, and confirmation bias. False precision means treating a metric like “2.37% conversion rate” as more meaningful than “roughly 2.4%.” The extra decimal creates an illusion of accuracy that does not exist in noisy marketing data. Correlation versus causation errors lead teams to credit the wrong variable for a result. Confirmation bias causes analysts to stop looking once the data supports what they already believed.
Avoiding these traps requires balancing quantitative evidence with business context. A spike in direct traffic after a TV campaign looks like organic growth in the data. Without the context of the campaign, you misattribute the source and misallocate future budget. Numbers never carry their own context. You have to supply it.
“Data informs decisions but rarely decides alone. The best marketers combine data with experience, relationships, and strategic timing to achieve superior outcomes.”
Delivering insights effectively requires leading with the conclusion, not the methodology. Decision-makers do not need to see the analysis path. They need to hear: “Our paid social cost per acquisition rose 34% in Q2 because iOS privacy changes reduced our match rate on retargeting audiences. The recommended fix is shifting 20% of that budget to first-party email retargeting.” That structure, insight first, evidence second, recommendation third, drives action. Burying the conclusion at the end of a slide deck guarantees it gets missed.
Pro Tip: When presenting findings to stakeholders, use the “so what” test on every chart. If you cannot answer “so what?” in one sentence, the chart is not ready to share.
- Lead every insight with the implication, not the data point.
- Separate what the data shows from what it means for the business.
- Flag the confidence level of any finding based on sample size and data quality.
- Identify what additional data would change the conclusion, and decide whether collecting it is worth the cost.
How can digital marketers apply analytics and insights to optimize campaigns?
Predictive and prescriptive analytics produce the clearest campaign improvements when applied to targeting and budget allocation. A predictive model trained on past purchase behavior can identify which users are within 30 days of converting, letting you concentrate spend on high-probability prospects rather than broad awareness audiences.
Audience segmentation is the most immediate application of data-driven decision making for most marketing teams. Splitting your email list by recency, frequency, and monetary value (RFM segmentation) and sending different messages to each tier consistently outperforms sending one message to the full list. The data tells you who to talk to. The insight tells you what to say.
Funnel optimization is the second major application. Analytics identifies exactly where users exit a conversion flow. Insights explain why. A 70% drop-off on a checkout page is analytics. The insight is that mobile users abandon at that step because the form requires 12 fields and the keyboard covers the submit button. One is a number. The other is a fix.
Analytics in marketing drives measurable ROI improvements when teams commit to iterative testing. Each campaign cycle generates data. That data feeds the next round of decisions. The loop compounds over time, and teams that run it consistently outperform those that treat analytics as a quarterly reporting exercise.
Data quality is the foundation that makes all of this work. Broken pixels, misconfigured tags, and schema mismatches corrupt the data before analysis even begins. Trackingplan monitors analytics implementations in real time, detecting tracking errors and alerting teams via Slack, email, or Teams before bad data contaminates reporting. Clean data is not a nice-to-have. It is the prerequisite for every technique described above.
Pro Tip: Audit your tracking implementation before launching any major campaign. A broken conversion pixel discovered after a $50,000 spend is an expensive lesson in data quality.
- Use RFM segmentation to personalize messaging by customer value tier.
- Apply funnel analysis to identify the single highest-impact drop-off point, then fix it before testing anything else.
- Run predictive models on historical purchase data to prioritize retargeting spend.
- Set up real-time anomaly alerts so tracking failures surface within hours, not weeks.
What are the challenges of building a data-driven marketing culture?
Culture is a bigger barrier to analytics adoption than technology. Most organizations have access to sufficient data and adequate tools. The obstacle is getting teams to use findings consistently rather than defaulting to instinct or seniority.
Data paralysis is the most common failure mode. Teams collect more data than they can act on, spend weeks in analysis, and miss the window to make a decision. The fix is discipline: gather only the data that would meaningfully change a specific decision. Before adding a new metric to a dashboard, ask what decision it informs. If the answer is unclear, the metric does not belong there.
Building a data-driven culture requires rewarding evidence and transparency over instinct and confidence. That means celebrating a campaign that failed because the data predicted it would fail just as much as celebrating a campaign that succeeded. It means making analysis visible and shareable, not siloed in one team’s spreadsheets.
Collaboration between analysts and marketers is the structural fix. When analysts own the data and marketers own the decisions, insights get lost in translation. Shared ownership, where both teams agree on the question before the analysis starts, produces findings that actually change behavior.
- Define the decision before starting the analysis.
- Share data and methodology openly across teams.
- Reward evidence-based reasoning even when the outcome is negative.
- Set a data-gathering deadline and make decisions with what you have by that date.
Key Takeaways
Analytics produces numbers. Insights produce decisions. The gap between them is where most marketing performance is won or lost.
| Point | Details |
|---|---|
| Define analytics vs. insights | Analytics examines data; insights are the conclusions that tell you what to do next. |
| Use all four analysis types | Move beyond descriptive reporting into diagnostic, predictive, and prescriptive methods for real gains. |
| Lead with the conclusion | Present the insight and its implication first, then support it with evidence to drive action. |
| Protect data quality | Broken tracking corrupts every downstream analysis; monitor implementations continuously. |
| Build a culture of evidence | Reward teams for using data to inform decisions, not just to confirm existing beliefs. |
Why most analytics programs underdeliver, and what actually fixes them
I have reviewed analytics setups across dozens of marketing teams, and the pattern is consistent. The tools are fine. The data volume is fine. The problem is almost always one of two things: the team is measuring outputs instead of decisions, or the data feeding the analysis is quietly broken.
The output-versus-decision problem is subtle. A team can spend weeks building a beautiful attribution dashboard and still not know where to shift budget next month. The dashboard answers “what happened” but not “what should we do.” That gap exists because no one defined the decision the dashboard was built to inform. AI-augmented analytics is making this worse in some organizations, not better. When you can generate 50 charts in the time it used to take to build five, the temptation to report everything and decide nothing grows.
The broken data problem is more damaging because it is invisible. A misconfigured event tag sends wrong conversion data for three weeks before anyone notices. Every decision made during those three weeks was based on fiction. Marketing analytics integrity is not a technical concern that lives with the dev team. It is a business concern that belongs to every marketer who uses the data.
My honest recommendation: spend as much time validating your tracking as you spend analyzing its output. The ratio in most teams is inverted.
— David
Trackingplan and the analytics reliability problem
Reliable analytics starts before the dashboard. It starts with the tracking implementation that feeds it.
Trackingplan monitors your digital analytics tools continuously, detecting broken pixels, missing events, schema mismatches, and campaign misconfigurations the moment they occur. Real-time alerts reach your team via Slack, email, or Teams so you fix issues in hours, not weeks. For marketing teams running campaigns where every conversion matters, that speed is the difference between clean data and a corrupted report. Trackingplan also covers privacy compliance checks and provides dashboards that give your full Martech stack visibility in one place. If your 2026 marketing strategies depend on accurate measurement, the foundation has to hold.
FAQ
What is the difference between analytics and insights?
Analytics is the process of collecting and examining data. Insights are the specific, contextual conclusions drawn from that analysis that inform a decision or action.
What are the four types of data analysis in marketing?
The four core types are descriptive, diagnostic, predictive, and prescriptive analytics. Each answers a progressively more complex marketing question, from what happened to what you should do next.
How do you avoid common data interpretation mistakes?
Avoid false precision, correlation-causation errors, and confirmation bias by always pairing quantitative findings with business context and flagging the confidence level of every insight before presenting it.
Why does data quality matter for marketing analytics?
Broken tracking implementations corrupt data before analysis begins. Decisions made on bad data produce bad outcomes regardless of how sophisticated the analysis method is.
How can marketers overcome data paralysis?
Effective analytics requires gathering only data that would change a specific decision. Define the decision first, then collect the minimum data needed to inform it.