Advanced Views, formerly Advanced Reports, are ready-made views that monitor and analyze data quality trends, such as lost events against the data layer, duplicate events or consent percentages.
Each one answers a question you’d otherwise work out by hand: are events getting lost, firing twice, ignoring consent? You spot irregularities, validate implementations and know your data holds up across destinations.
You’ll find them in the Reports section of Trackingplan’s sidebar.
A dropdown lists every view available, each with a short explanation of what it shows and when it’s useful.
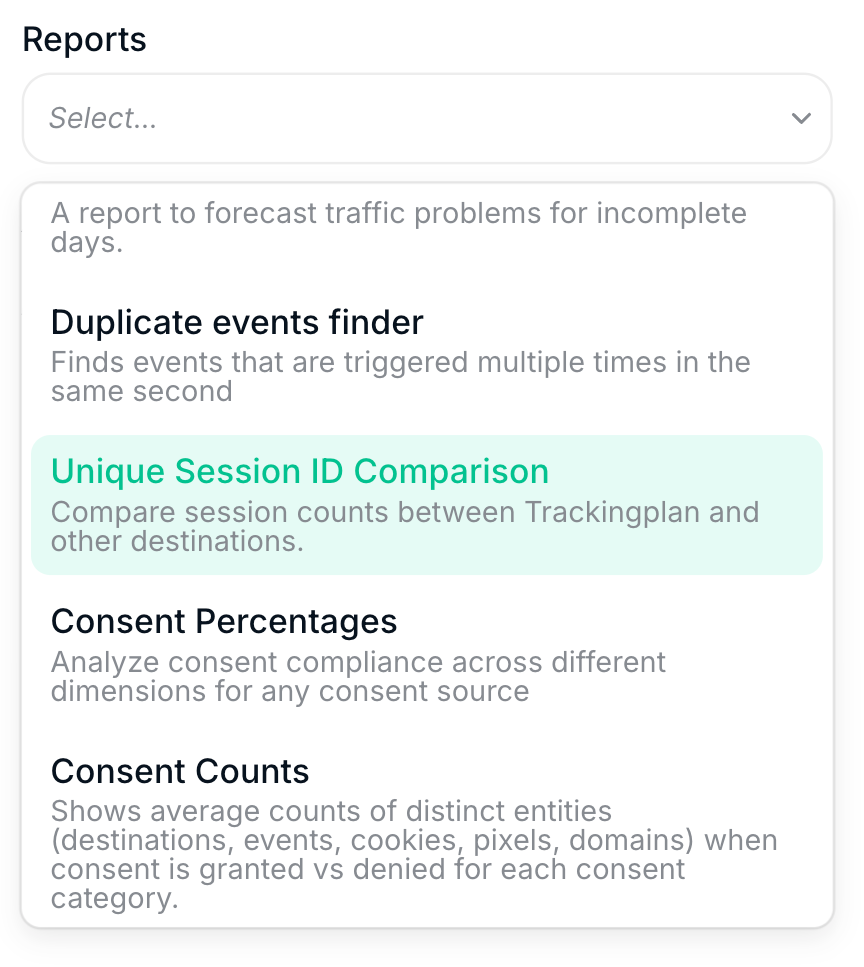
Pick one and it opens as a table view, ready to explore.
Lost Events vs. Data Layer Report
This view compares GTM Data Layer events with the destination events that share their normalized name. It shows how many events fired in your Data Layer, how many each destination actually received, and the gap between the two.
Use it to estimate the events lost between your GTM Data Layer and destinations like Meta, Google Ads or GA4, and to size the impact on attribution before it hurts campaign performance.
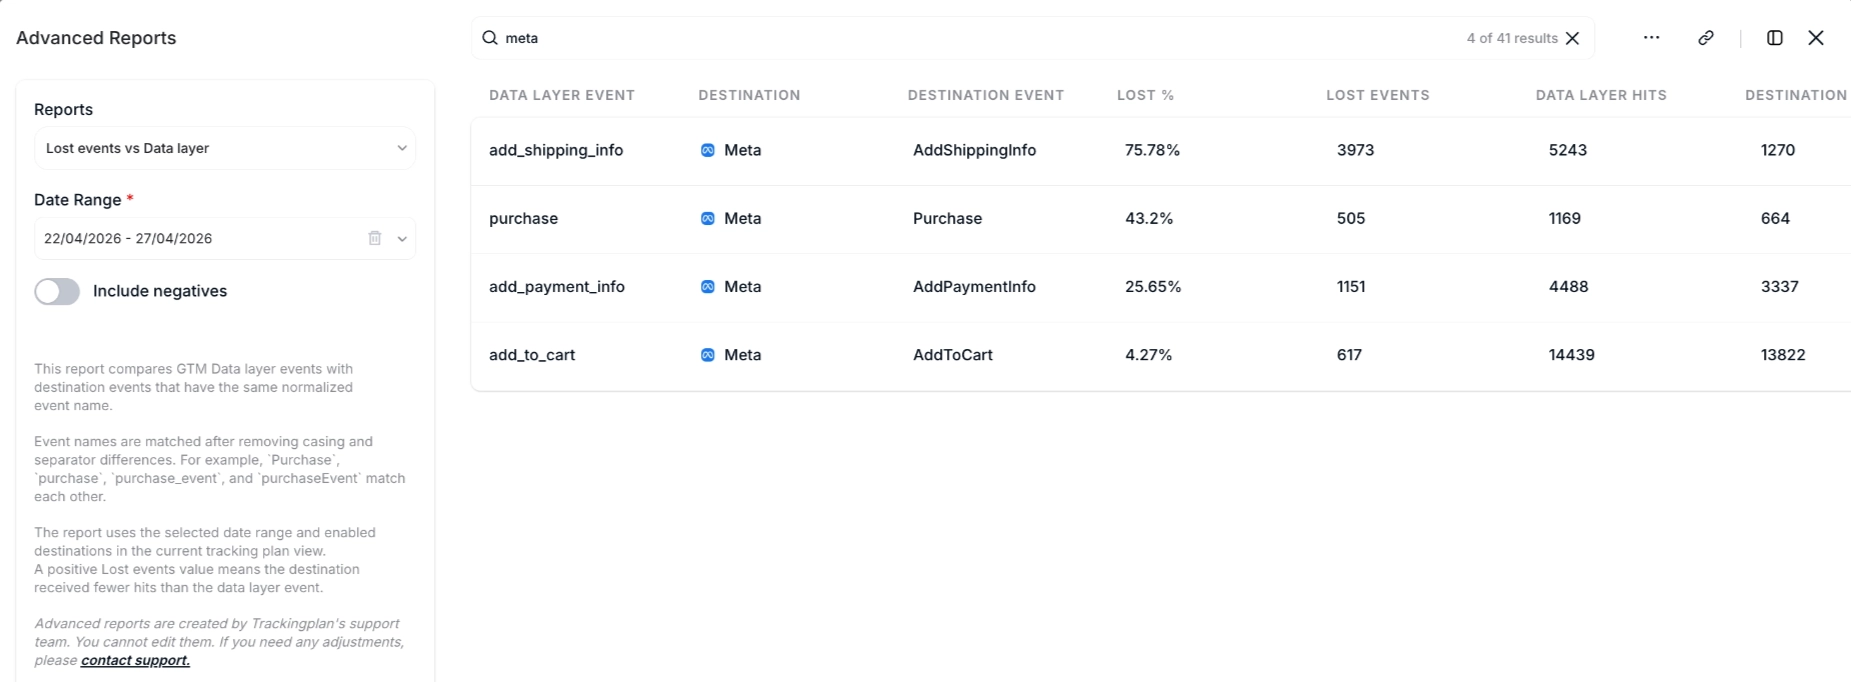
Set the parameters in the left panel:
- Date Range: the time window to analyze. A recent range catches active gaps; a longer one shows persistent problems.
- Include negatives: also shows event pairs where the destination received more hits than the data layer, which can mean duplicate firing or misconfigured destination triggers.
You then get a table with these columns:
- Data Layer Event: The event name as it appears in your GTM Data Layer (e.g.
Signup_Viewed). - Destination: The analytics or marketing provider receiving the event (e.g. GA4, Meta, etc.).
- Destination Event: The event name as it arrives at the destination (e.g.
Signup_Viewed). - Lost %: The percentage of data layer hits that never reached the destination (e.g. 64.68%). The higher it is, the bigger the tracking gap.
- Lost Events: The number of events that fired in the DataLayer but didn’t reach the destination in the selected date range (e.g. 379).
- Data Layer Hits: How many times the event fired in the data layer (e.g. 586).
- Destination Hits: How many times the destination received the equivalent event (e.g. 207).
How Event Matching Works
Event names are normalized before they are compared. Differences in casing and separators are removed, so Purchase, purchase, purchase_event, and purchaseEvent all match. Naming inconsistencies between your GTM DataLayer and your destinations don’t skew the results.
Advanced Views are created by Trackingplan's support team and can’t be edited. Need a change? Contact support.
Duplicate Events Finder
This view looks for user sessions where the same event appears several times in the same second, so you can spot unintended duplicates, such as a “purchase” or “signup” event firing more than once per user interaction.
Several fires in the same second are a common sign of double tracking or a wrong event implementation.
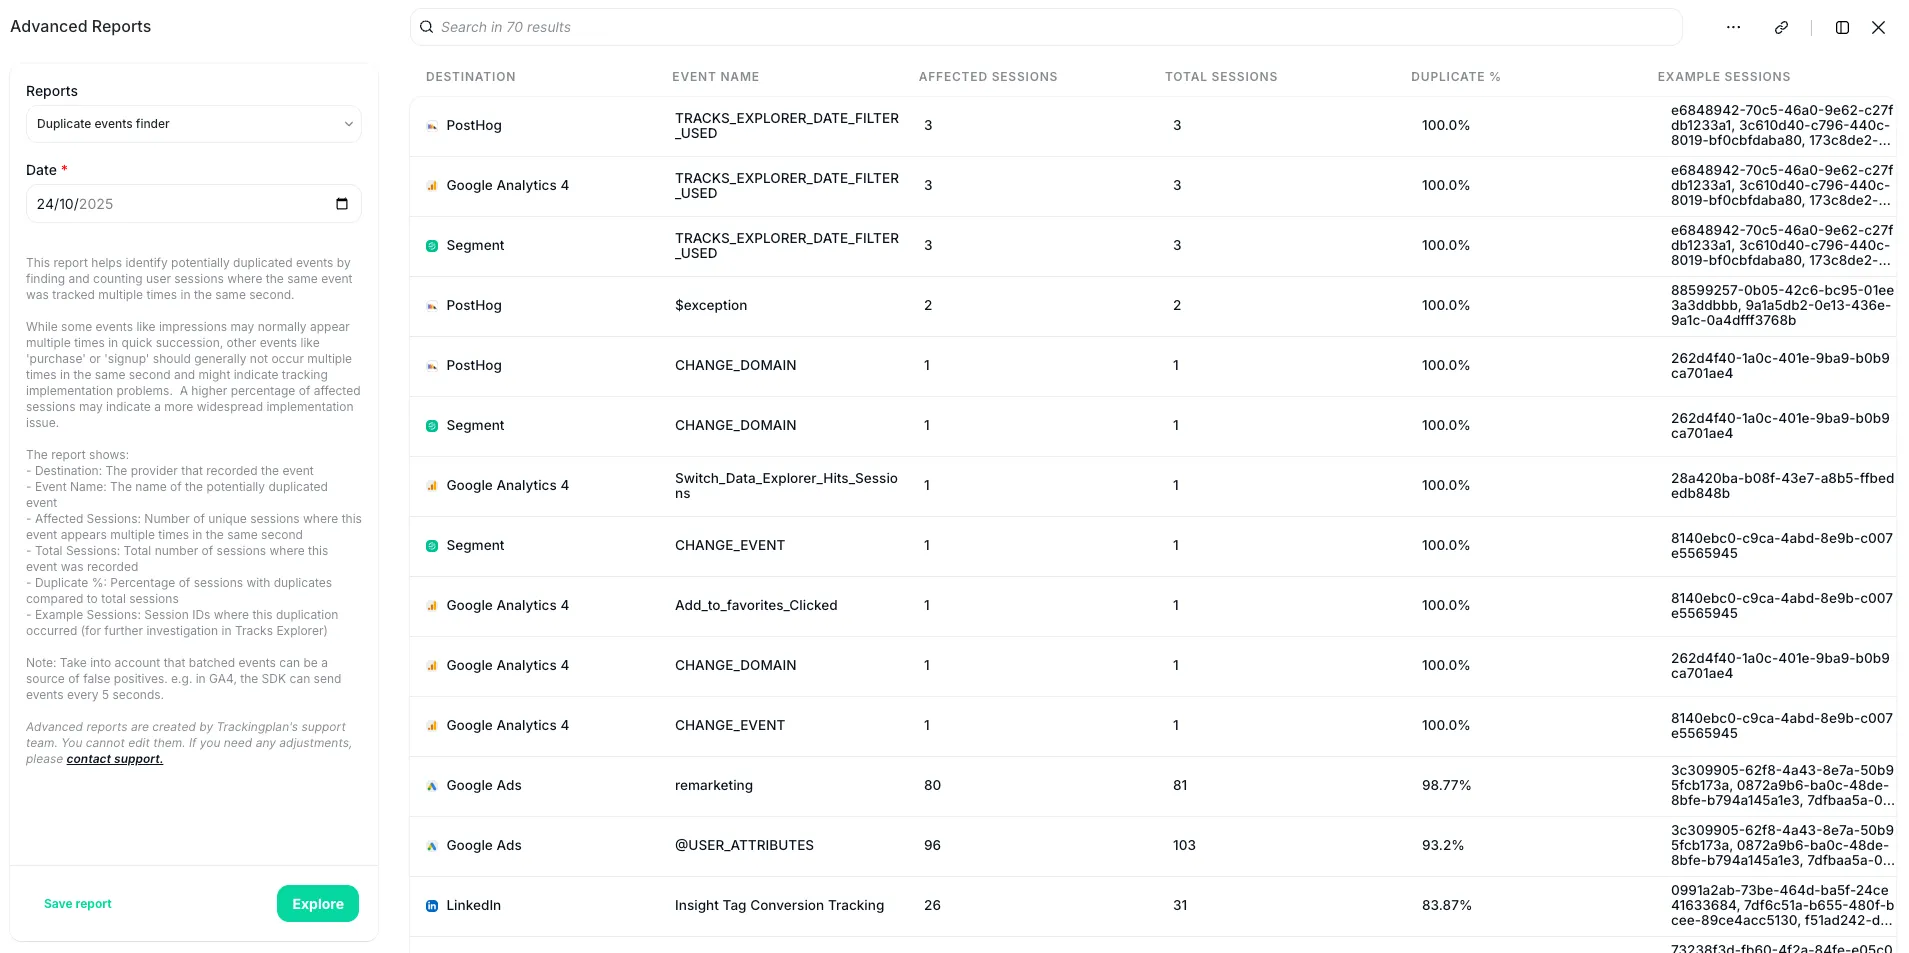
Select the specific date you want to look at, for example the day after a release or a tag change. Trackingplan scans your event data for any event fired several times within one second in the same user session, and shows a table with these columns:
- Destination: the analytics or marketing platform where the duplicated event was recorded (e.g., Google Analytics 4, Meta Pixel, Segment, etc.).
- Event Name: the name of the possibly duplicated event (
purchase,signup,add_to_cart)…). - Affected Sessions: the number of unique user sessions where the event fired several times in the same second. These are the sessions worth a closer look.
- Total Sessions: the number of sessions where the event was recorded at least once, duplicated or not, so you can see how big the problem is.
- Duplicate %: the share of sessions with duplicates out of the total. The higher it is, the broader or more recurrent the problem in your tracking setup.
- Example Sessions: session IDs where the duplicate was detected. Click or copy them to open them in Trackingplan’s Tracks Explorer and see what happened in each case.
Tips and Considerations
- Some events naturally occur multiple times: events like
impressionorscrolloften fire several times, and that isn’t necessarily a problem. - Focus on transactional or one-time actions: events like
purchase,signup, orform_submitshould usually happen once per user interaction. Ifpurchaseappears twice in one second in several sessions, the confirmation page may be firing it on both page load and button click. - Beware of false positives: batched events can cause them. Some platforms (like GA4) send events in batches every few seconds, so identical events can look as if they happened “in the same second” even though they were collected separately.
Unique Session ID Comparison Report
This view compares the number of unique sessions Trackingplan recorded with the number each destination recorded (e.g., Google Analytics, Segment, Amplitude…).
Use it to find problems with session tracking.
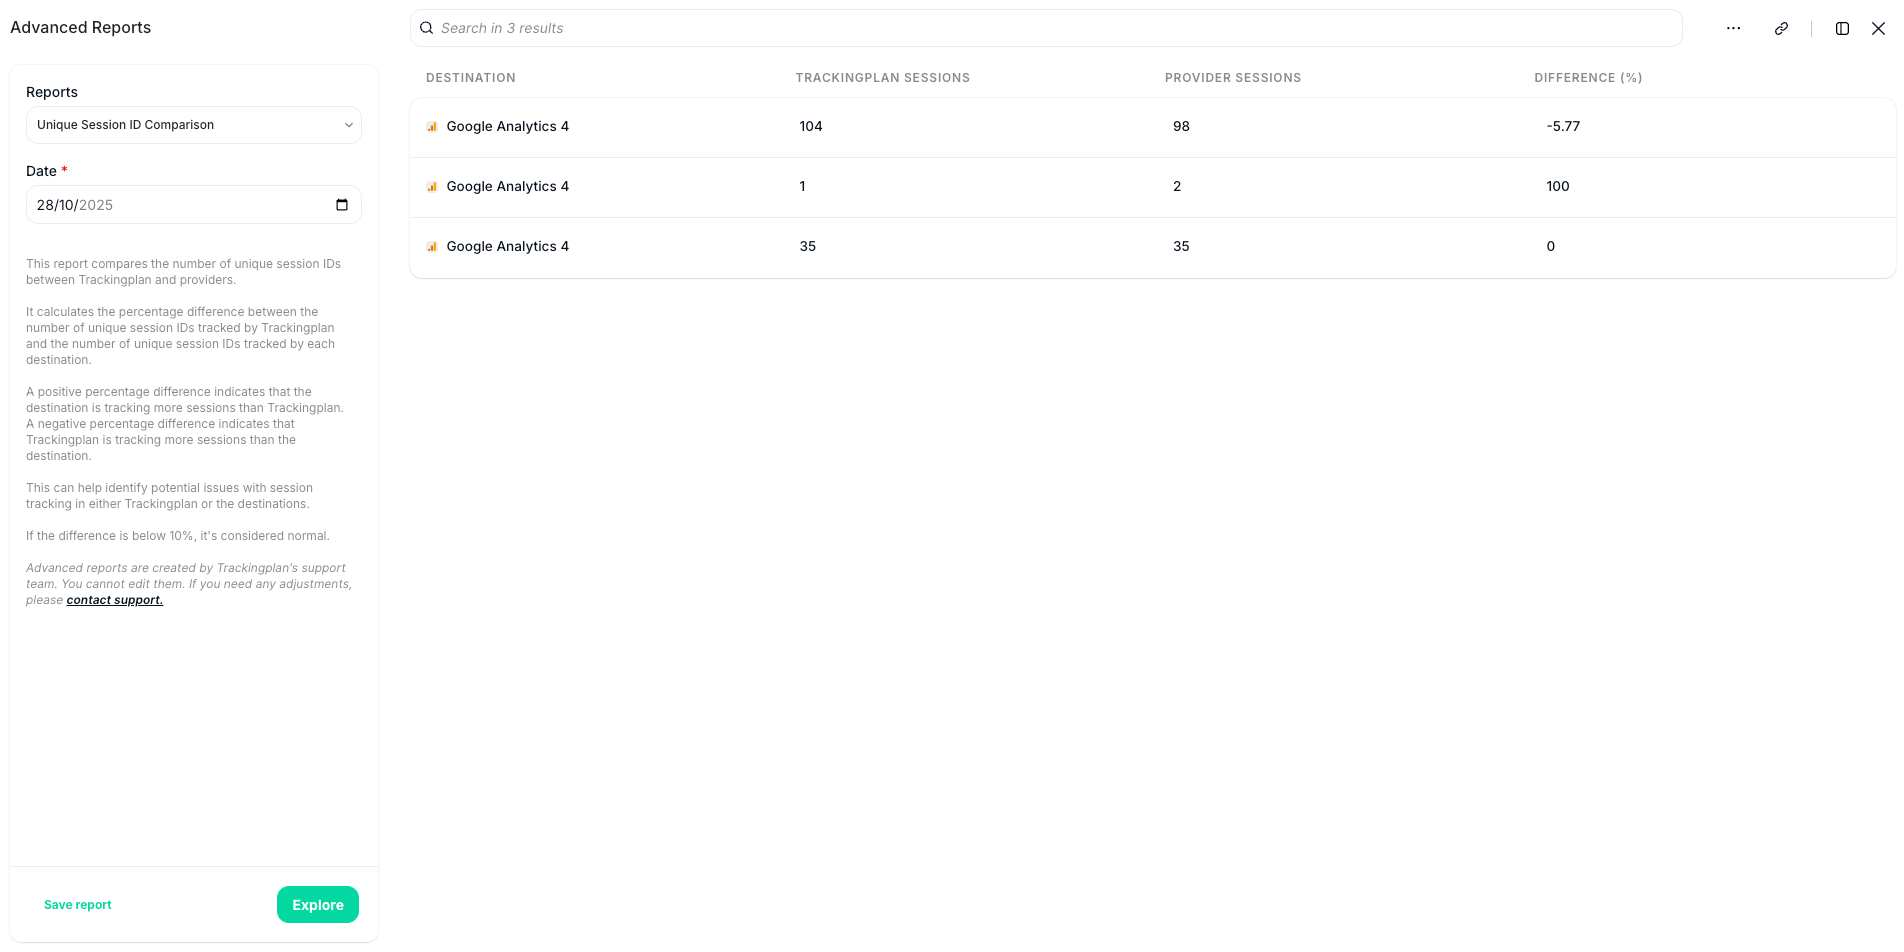
Select a timeframe and you get a table with these columns:
- Destination: the analytics or marketing platform being compared (e.g., GA4, Amplitude, Segment).
- Trackingplan Sessions: the unique sessions Trackingplan detected in the selected timeframe.
- Provider Sessions: the unique sessions each integrated provider detected.
- Difference (%): the percentage difference between the unique session IDs tracked by Trackingplan and those tracked by each destination.
- A positive difference means the destination tracks more sessions than Trackingplan.
- A negative difference means Trackingplan tracks more sessions than the destination.
Normal variations (±10%) are usually expected, because of timing differences or how each platform defines a session.
Example
Say you compare last week’s sessions in Trackingplan and Google Analytics 4 and see this:
Destination | Trackingplan Sessions | Provider Sessions | Difference (%) |
|---|---|---|---|
GA4 | 48,000 | 57,600 | +20% |
How to interpret this:
GA4 reports 20% more sessions than Trackingplan. The difference may come from:
- Session timeout duration (e.g., GA4 resets after 30 minutes of inactivity).
- Event batching or deduplication settings.
- A missing hit or an inconsistent session ID setup in your instrumentation.
If Trackingplan shows more sessions, it could mean:
- Some hits have never reached the destination (network errors or tag misfires).
- Your destination has applied filters or privacy settings that discard part of the traffic.
Consent Percentages Report
This view tells you whether your website or app respects what users chose about consent: for example, that no marketing, analytics or personalization data is sent when users haven’t given permission.
Use it to validate your Consent Management Platform (CMP) configuration and avoid accidental data collection that could breach privacy regulations, like GDPR or CCPA.
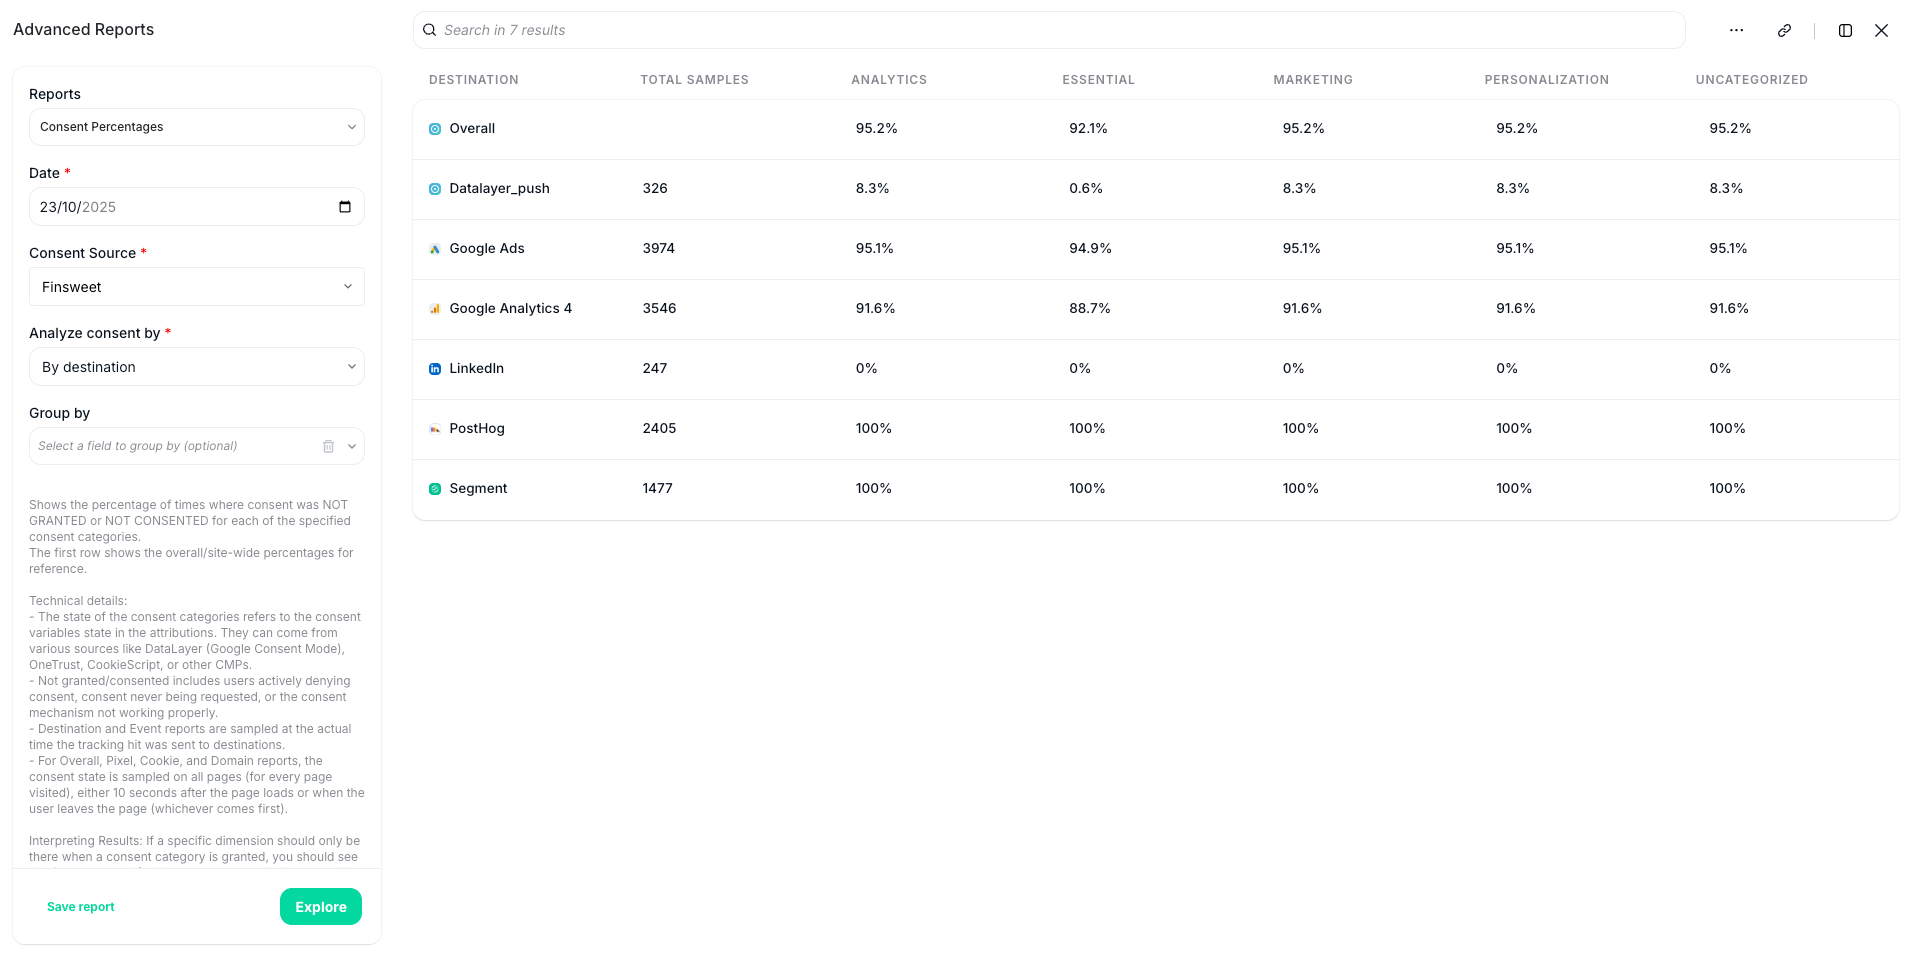
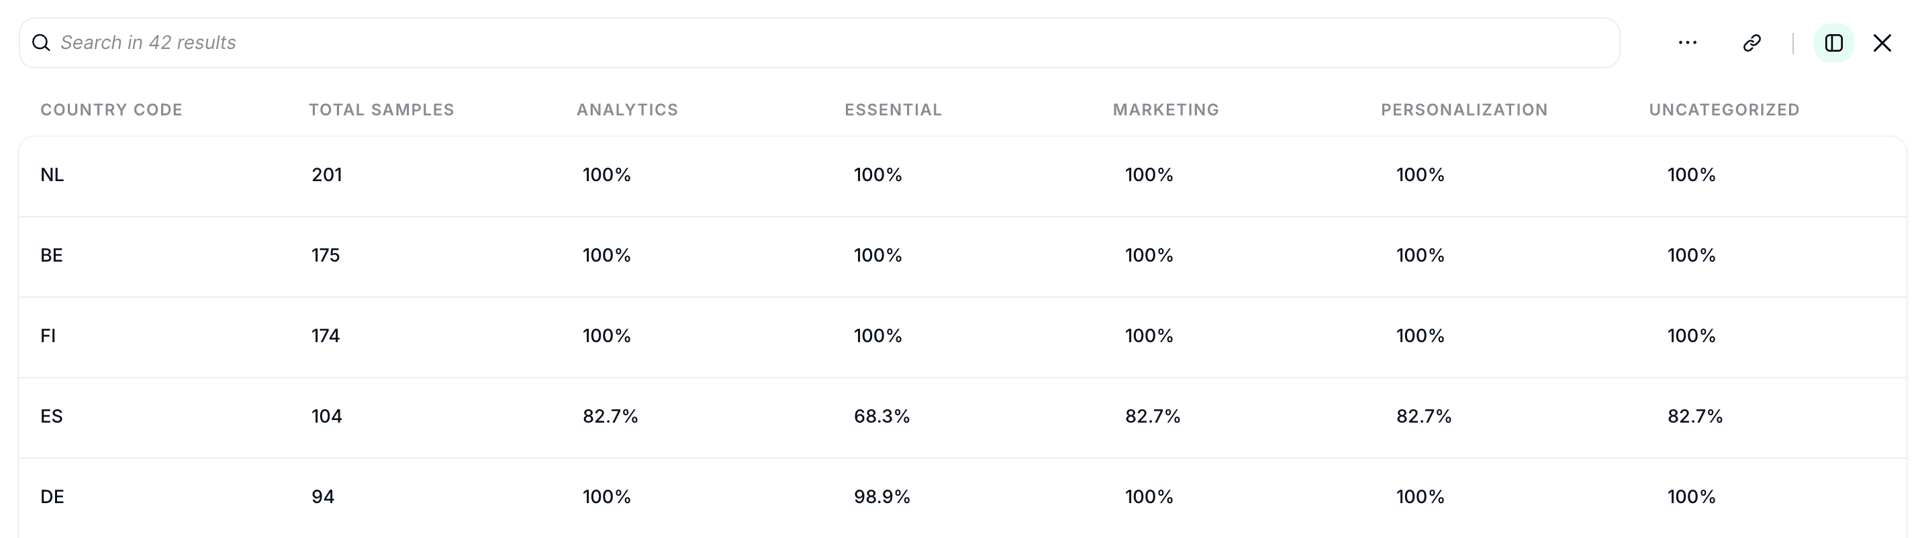
When you open the Consent Percentages Report, the panel on the left lets you set these parameters:
- Date: a specific day, or a date range to see how consent evolves over time.
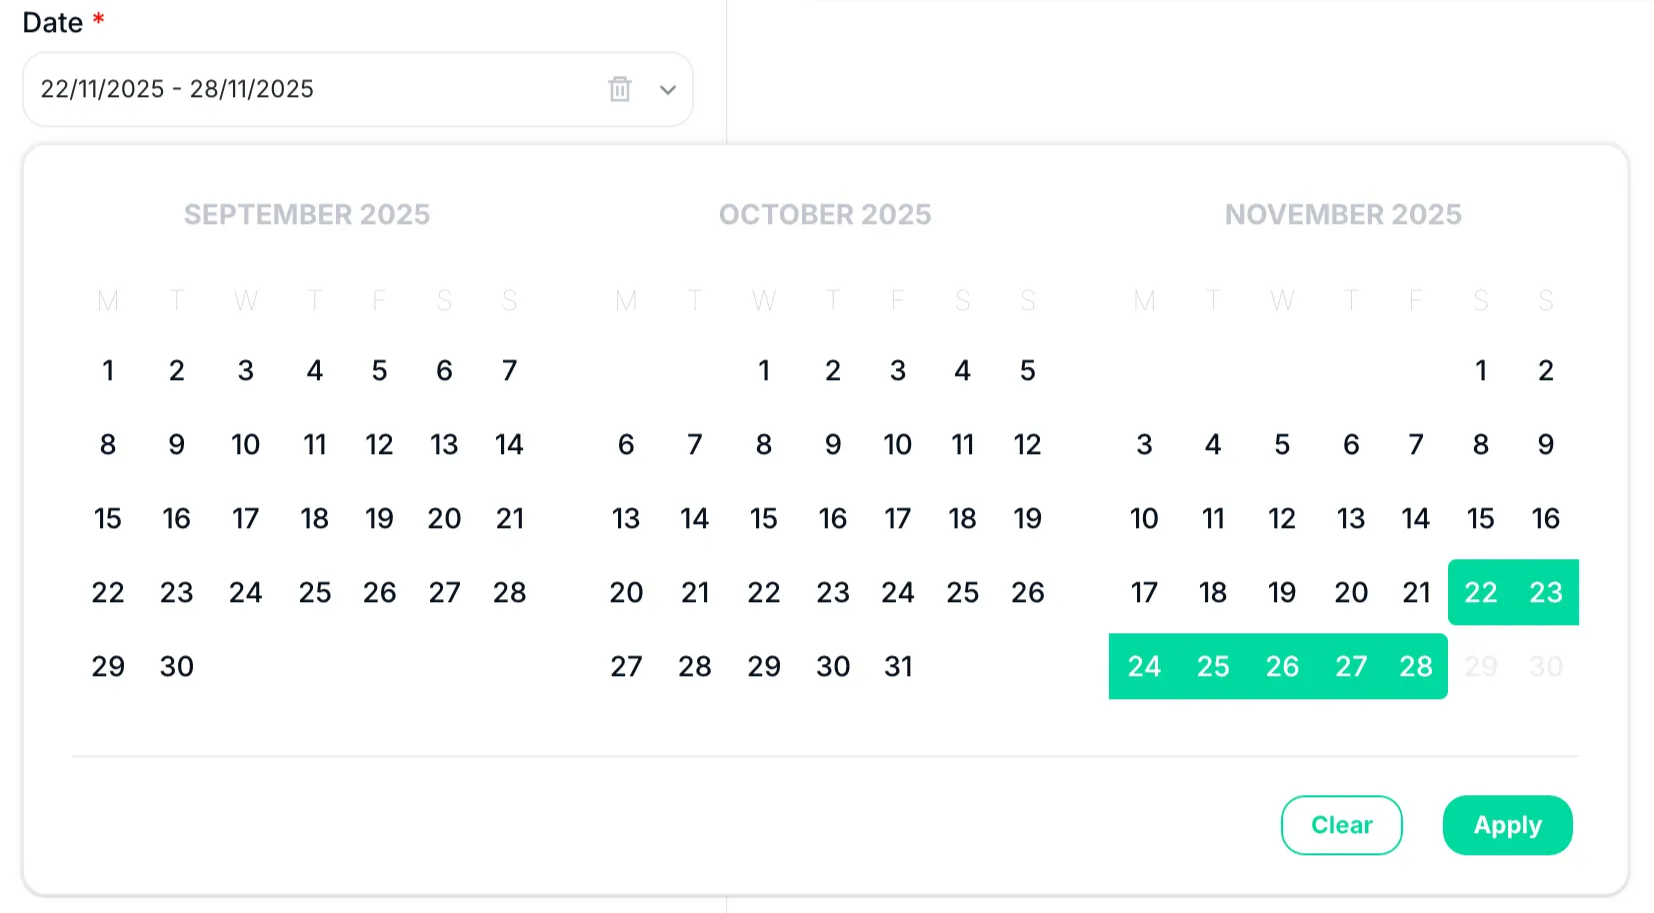
- Consent Source (DataLayer, Finsweet, OneTrust, CookieYes, etc.)
- Analyze consent by:
- By core event: shows which key user interactions (page_view, purchase, signup, etc.) are occurring without the required consent.
- By destination: shows which providers(Google Analytics, Meta, Google Ads, etc.) are receiving data without proper consent. Use it to check that each destination is wired to your CMP correctly and that no vendor collects data when consent is denied or only partly granted.
- By destination and event: goes one level deeper, destination or event combination by combination. It catches partial misconfigurations, such as a destination that usually respects consent but still receives specific events (e.g. page_view or purchase) without permission.
- By cookie present on the page: audits the cookies being set or read when consent has not been granted. Use it to check that marketing or analytics cookies aren’t created too early, and to find cookies that may be getting around your CMP rules.
- By known pixel: looks at the recognized tracking pixels (such as Meta, TikTok, LinkedIn, etc.) on the page. Confirm that each pixel fires only when its consent category is accepted, and spot third-party pixels loading when they shouldn’t.
- By contacted domain: shows the average number of distinct third-party domains contacted per page load when consent is not granted. It gives you the overall privacy footprint of your site or app, and reveals unexpected external requests that could point to hidden trackers or misconfigured scripts.
- Group by (optional): compare consent behavior by country, device, language or any other attribution field, to find implementation differences between markets or devices (for example, “France vs. Germany” or “mobile vs. desktop”).
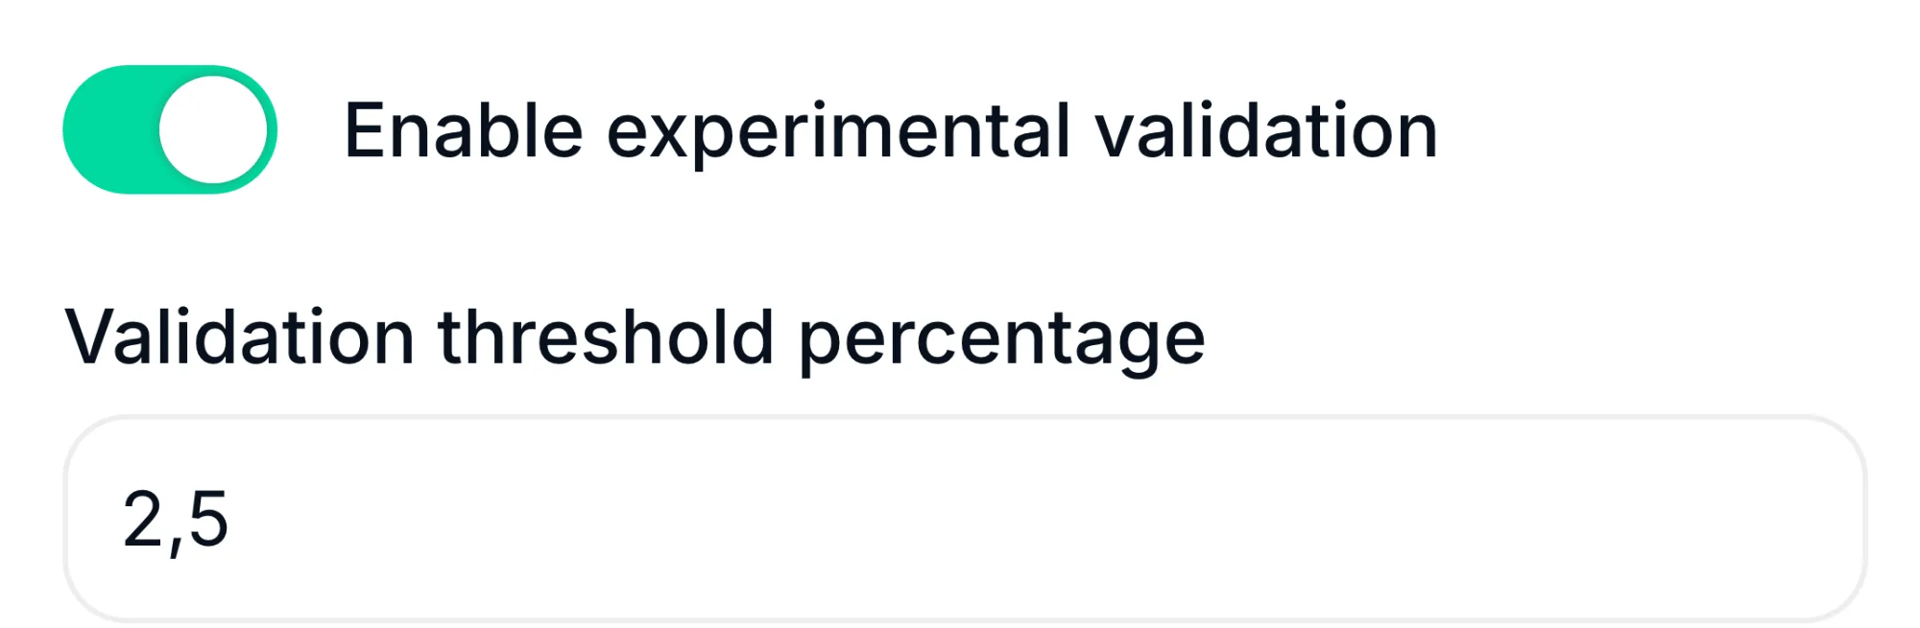
- Enable experimental validation: any value above 0% may deserve a look, and this option helps you quickly identify what requires immediate attention and what can wait.
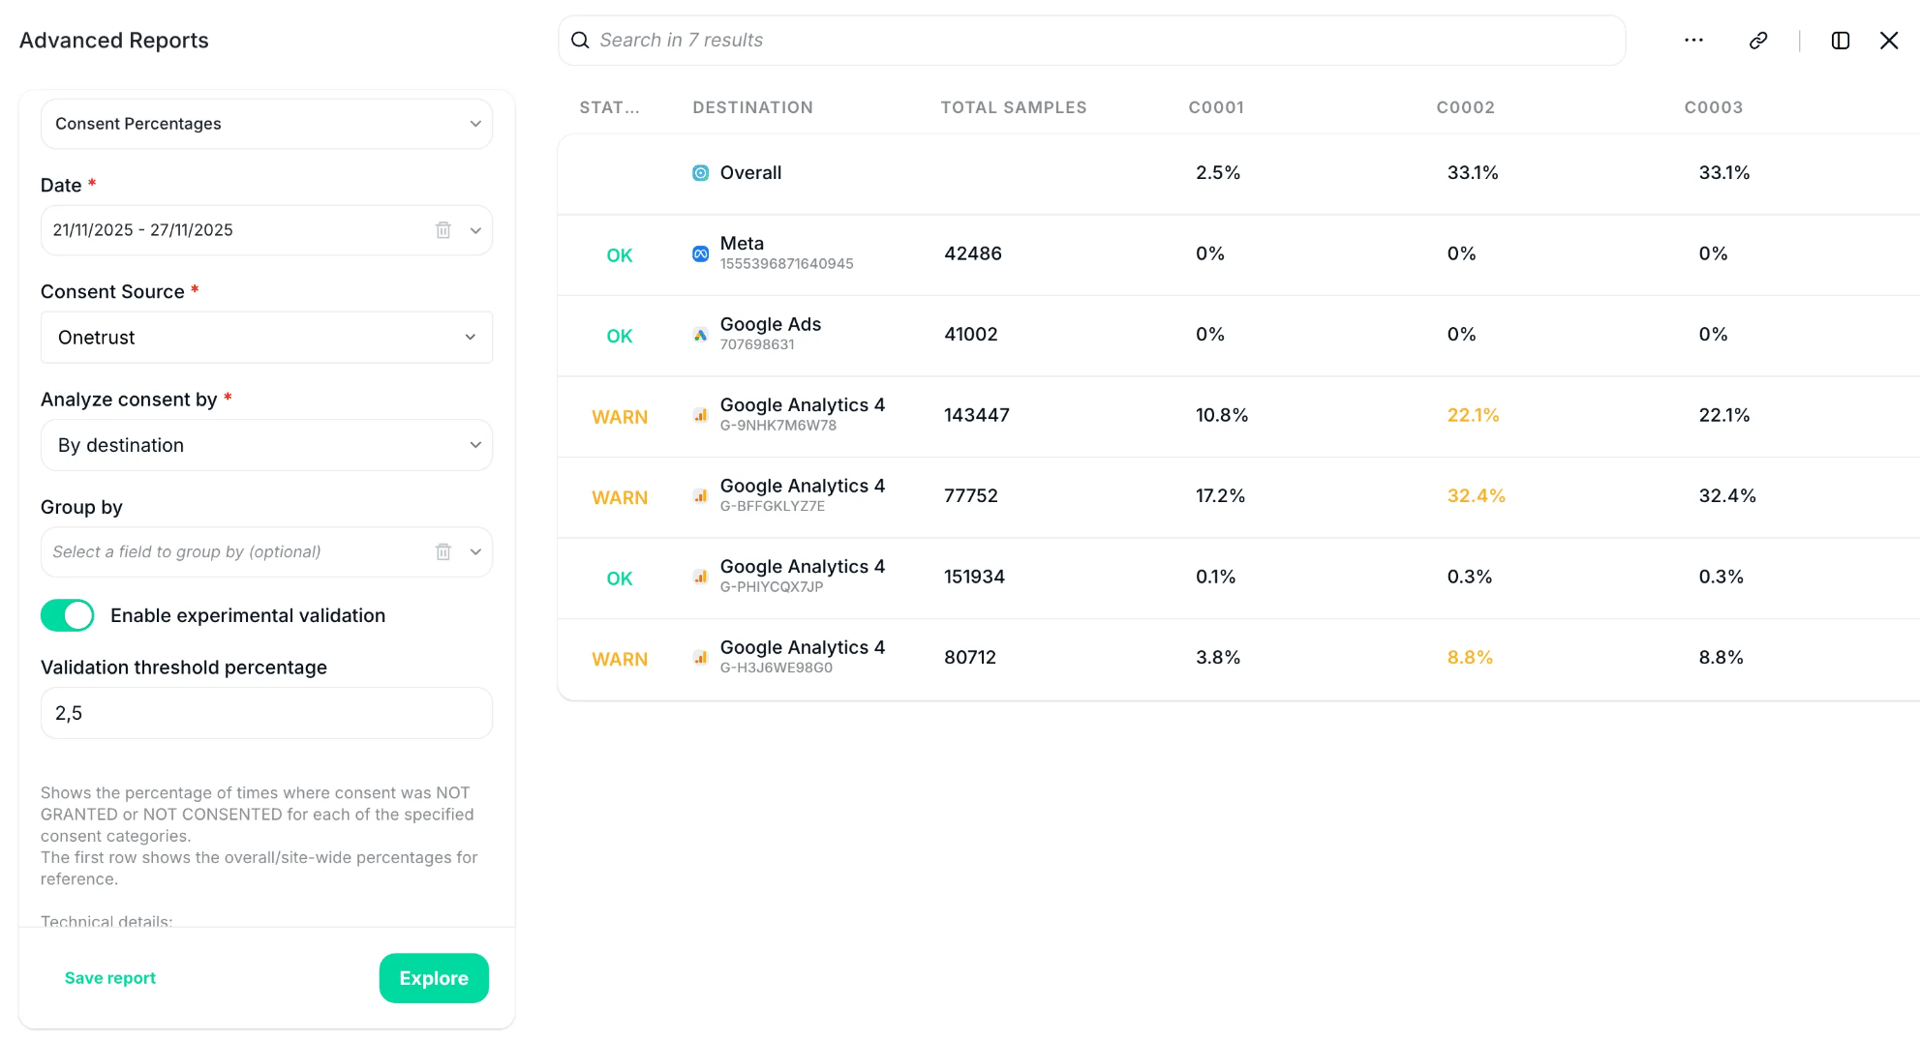
Turn it on to apply automated assessment rules, and set the threshold percentage to match your internal consent standards.
Interpreting results
With your parameters set, Trackingplan calculates the percentage of times consent was NOT GRANTED or NOT CONSENTED for each consent category.
- If something should only appear when a consent category is granted, you should see 0% (or close to it). A higher percentage means it is sent or used even without consent for that category.
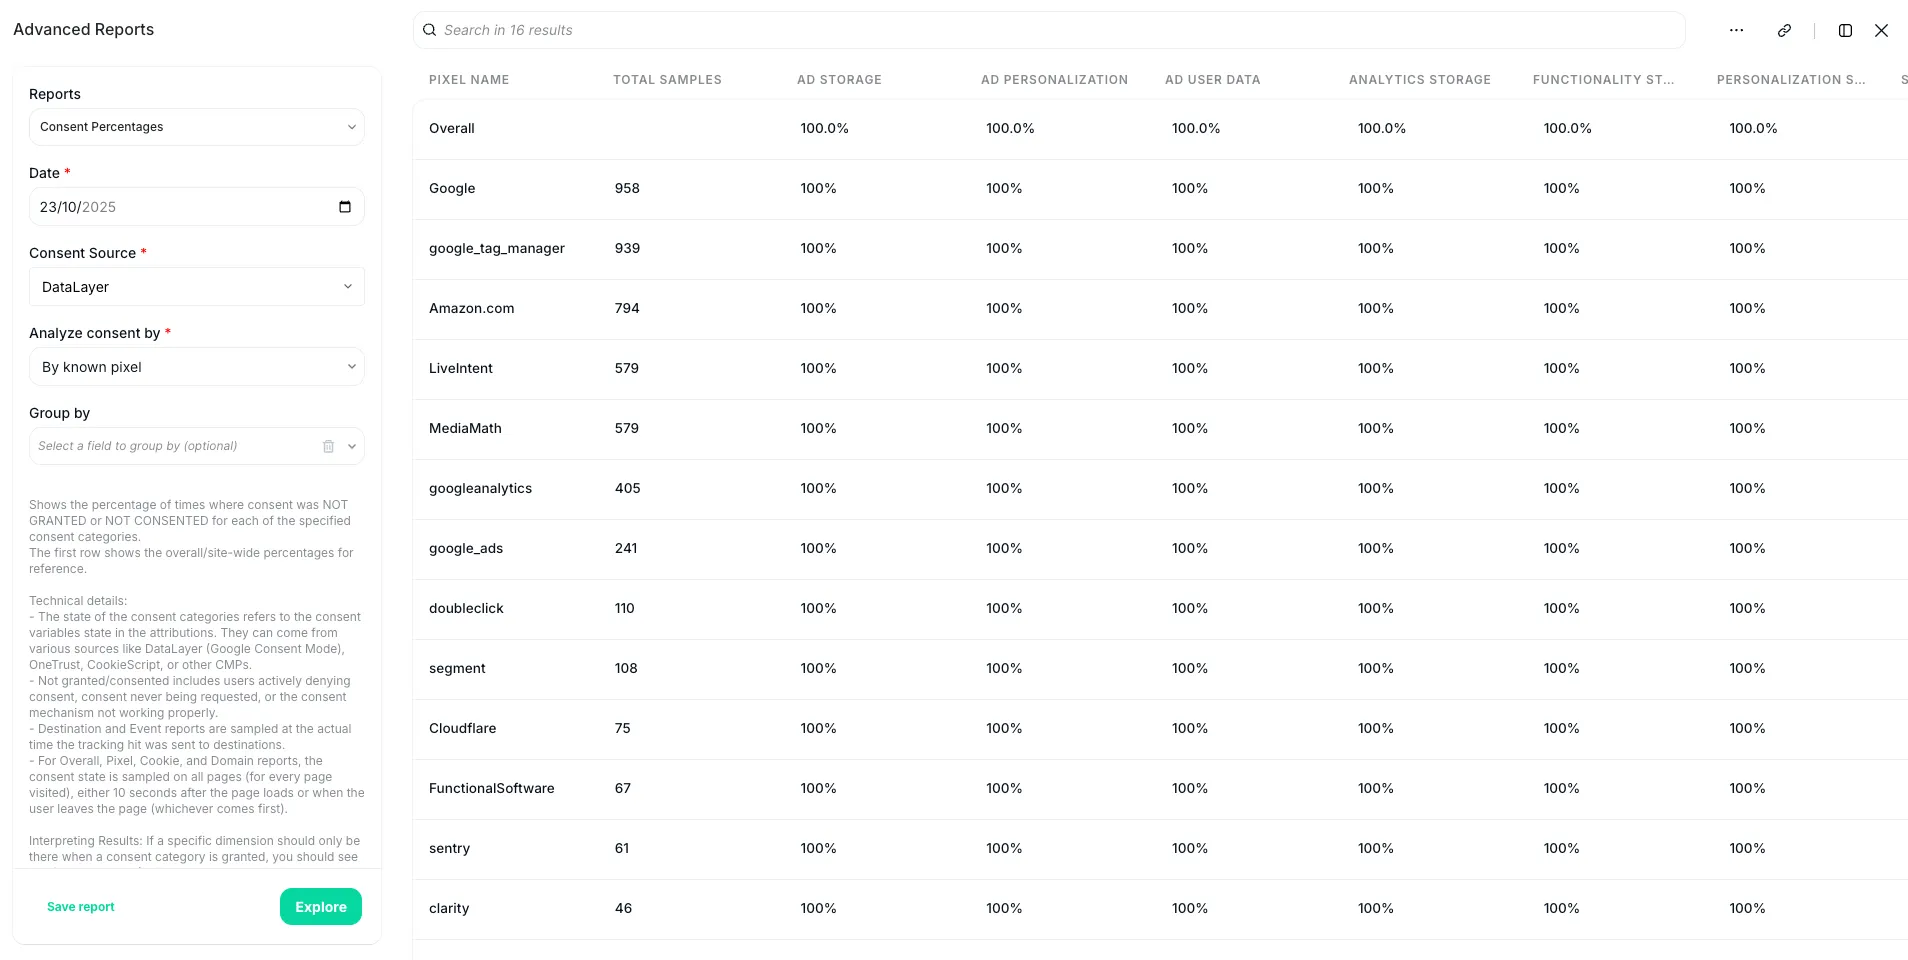
Hover over any value in the table for a tooltip that explains what it means. From the tooltip, go straight to Trackingplan's Data Explorer or Trackingplan’s Root Cause Analysis, already filtered, to keep investigating.

To see how to use the Consent Percentages Report for auditing cookies and consent management platforms (CMPs), watch the video below.
Consent Counts Report
This view counts how many distinct destinations, events, cookies, pixels or domains are active when consent is granted vs. when consent is denied.
Use it to check that your tracking respects what users chose, and to find where data may be collected without proper consent.
The Consent Percentages Report shows how often consent is ignored; the Consent Counts Report shows how much tracking activity occurs under granted vs. denied consent.
For example:
- If 10 analytics events fire when consent is granted and 8 still fire when it’s denied, your tag manager or CMP is probably misconfigured.
- If several marketing pixels or third-party domains load without consent, that’s a privacy compliance risk.
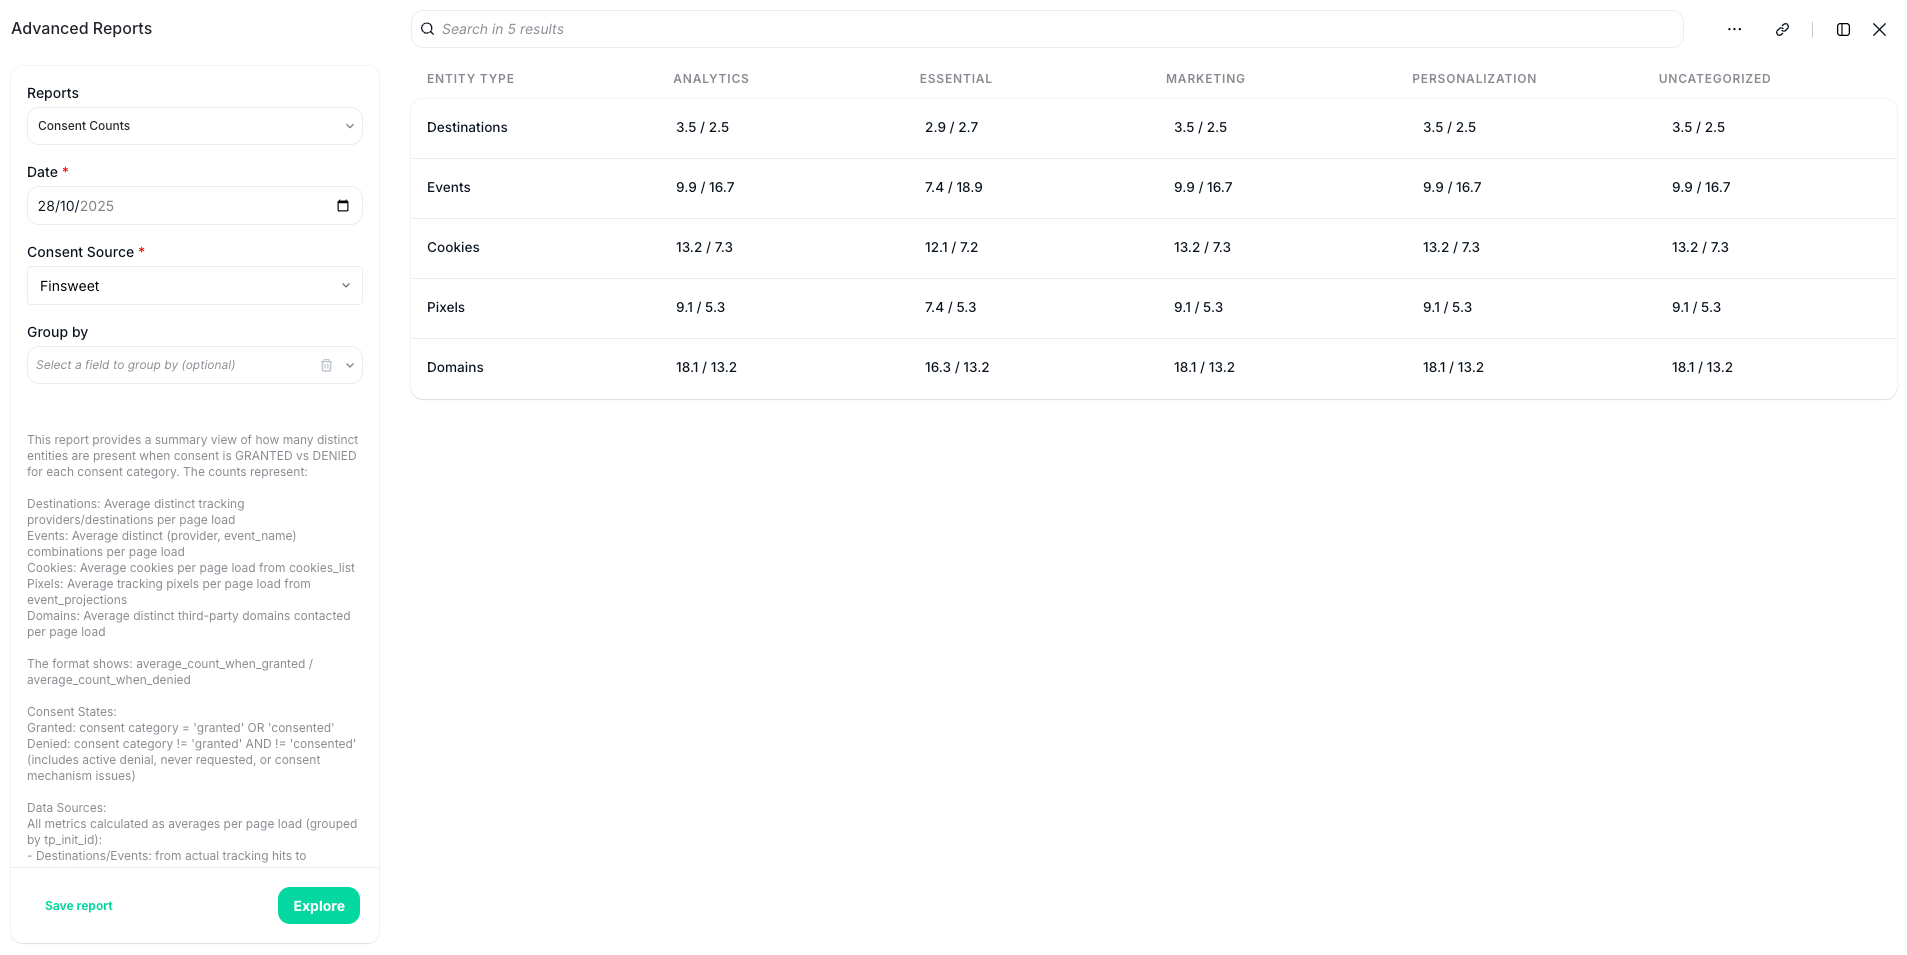
It’s especially useful for auditing tracking behavior across multiple categories and destinations.
Set these parameters in the left-hand panel:
- Date: the timeframe to analyze.
- Consent Source: the CMP or consent mechanism (e.g., DataLayer, OneTrust, CookieYes, Finsweet).
- Group by (optional): compare tracking activity by attribution, such as hostname, country, device type, page path or UTMs. For example, compare Spain and Germany to see whether consent is enforced differently.
You then get the average counts of distinct entities when consent is granted vs denied, for each consent category:
- Destinations: average distinct tracking providers/destinations per page load.
- Events: average distinct (
provider,event_name) combinations per page load. - Cookies: average cookies per page load from
cookies_list. - Pixels: average tracking pixels per page load from
event_projections. - Domains: average distinct third-party domains contacted per page load.
Compare Hits vs. Yesterday Same Time Report (available on request)
Don’t wait for the day to end to spot a traffic problem. This view compares the hits or sessions of each event today vs. yesterday, up to the same time of day.
Use it to catch traffic problems, such as drops or real-time gaps after a recent release or update, and missing data or events, early.
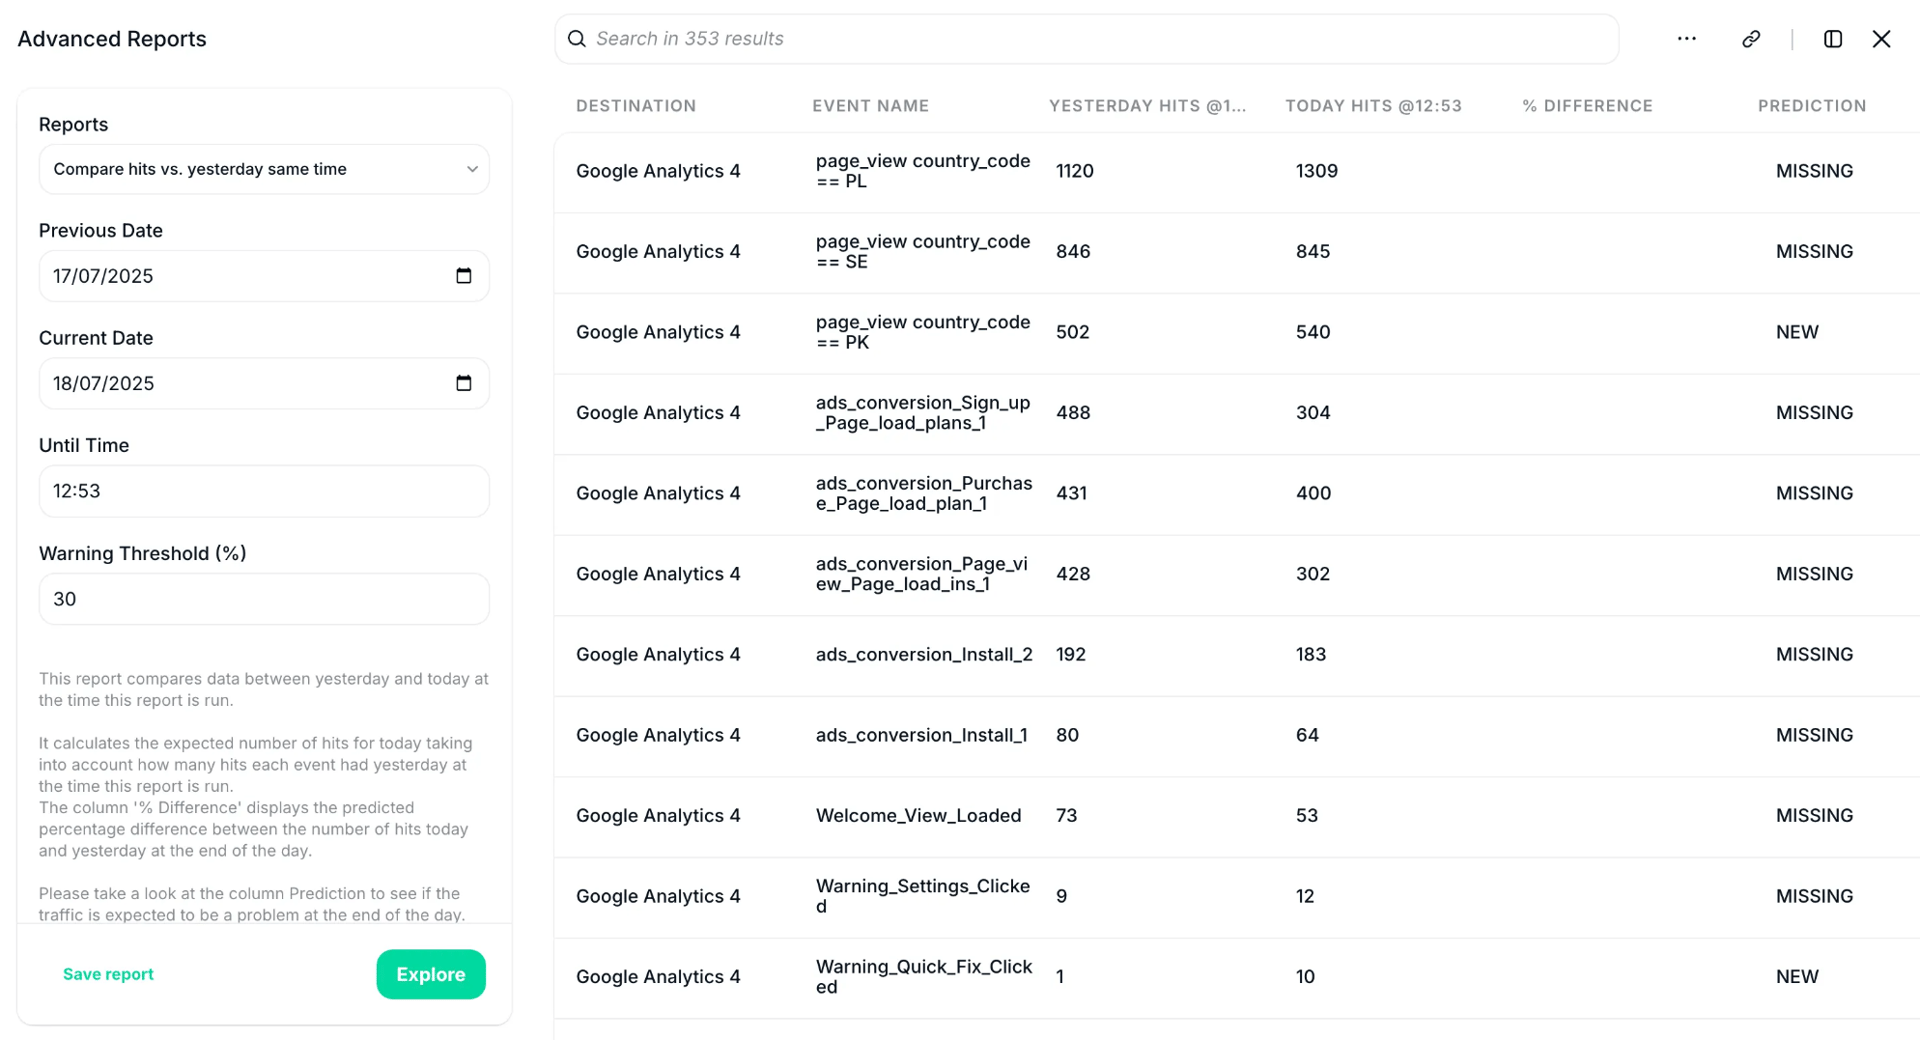
When you open the Compare Hits vs. Yesterday Same Time Report, the panel on the left lets you set these parameters:
- Previous Date & Current Date: the two timeframes to compare. Use them to see whether event volumes, hits or sessions went up or down against a reference point (e.g., yesterday, the same day last week, or a campaign launch).
- Until Time: the cutoff time for the comparison. For example, up to 11:00 AM today vs. the same time yesterday, so the comparison is fair. Handy when you’re watching a new release, an early-morning problem or a campaign that went live that morning.
- Warning Threshold (%): how big a change has to be to count as a warning. Any event or destination whose difference between the two periods is above it gets flagged. Set it to 30%, for instance, and any change above ±30%, up or down, appears as a warning. You see the anomalies that matter, without the noise of small, expected variations.
With your parameters set, Trackingplan calculates the expected number of hits from historical traffic patterns and predicts whether today’s traffic is on track, lower than expected, or a likely problem.
- It works out the expected number of hits for today from how many hits each event had yesterday at the same time.
- The % Difference column shows the predicted percentage difference between today's final value and yesterday's.
- The Prediction column tells you whether the event's traffic is likely to be a problem by the end of the day, using these thresholds:
Prediction
Meaning
DROP
Today's hits are expected to be more than 30% lower than yesterday.
PEAK
Today's hits are expected to be more than 30% higher than yesterday.
OK
The difference is within ±30%, so no major issue is expected.
NEW
No hits yesterday, but there are already hits today.
MISSING
There were hits yesterday, but none have been recorded today.
Playing with Your Reports
Advanced Views are preconfigured by Trackingplan’s support team, but you can still shape what you see:
- Adjust filters and thresholds using the left panel.
- Use the toggle sidebar for better readability.
- Sort data by type or event to create a more tailored view.
- Search within rows to quickly locate specific events or data points.
- Export to CSV to share insights with your team or analyze data further in external tools.
- Directly share your Advanced Views with your teammates using the Share button.
Need a change to an existing view, or a new one? Contact our support team.